by Chris Kimble | Feb 8, 2016 | Kimble Charting, Metals
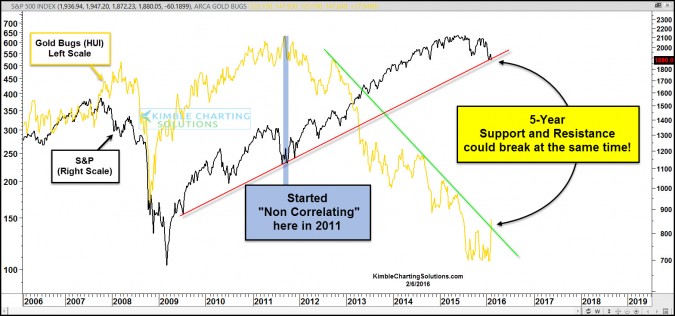
CLICK ON CHART TO ENLARGE S&P 500 has created a series of higher lows and higher highs for the past 5-years! Some would define this as a bull market. Gold Bugs Index (HUI) has created a series of lower highs and lower lows, for the past 5-years! Some would define...
by Chris Kimble | Feb 3, 2016 | Kimble Charting, Metals
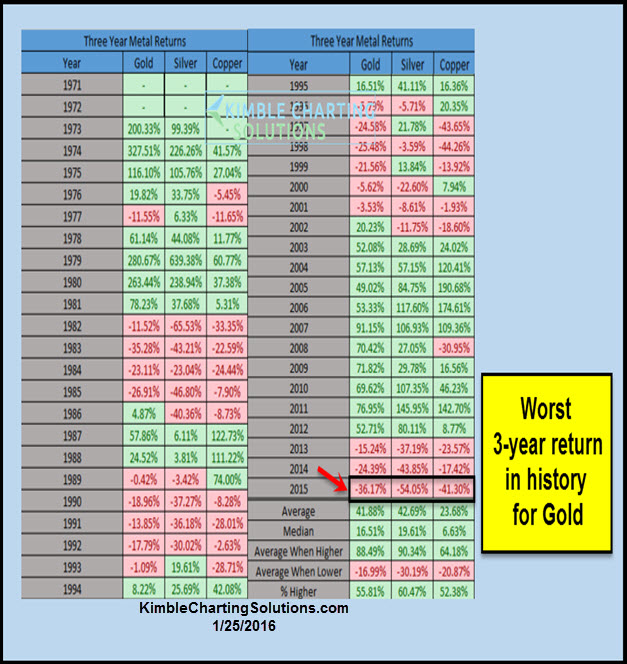
It’s been a rough 3-years for the metals space. “THE” worst 3-years in history for Gold and the 3rd worst 3-year performance in history, for Silver (see table below). The Power of the Pattern shared in 2011, that metals should be down for years to...

by Chris Kimble | Jan 25, 2016 | Kimble Charting, Metals
In the summer of the 2011, a rare set up was in place in the Gold and Swiss Franc markets. At the time the Power of the Pattern shared that Gold should be “Down for years to come.” See why we shared this near all-time highs in gold (HERE) Since that post,...

by Chris Kimble | Aug 20, 2015 | Kimble Charting, Metals
CLICK ON CHART TO ENLARGE This chart looks at the S&P 500/Gold Bugs ratio over the past 20-years. As you can see the ratio trended lower from 2000 to 2011, reflecting that the Gold Bugs index was stronger than the S&P 500 for over a decade. Over the past...

by Chris Kimble | Aug 12, 2015 | Kimble Charting, Metals
CLICK ON CHART TO ENLARGE This chart looks at the S&P 500/Gold Bugs (HUI) ratio over the past 20-years. The ratio fell for almost 11-years (2000 to 2011), meaning it paid to be long gold miners and short the S&P 500 in a big way during this time frame. Over...

by Chris Kimble | Jul 21, 2015 | Kimble Charting, Metals
CLICK ON CHART TO ENLARGE Mining stocks had a rough day yesterday to say the least. Popular mining ETF GDX fell almost 11% yesterday, hitting all-time lows. Does falling 10% or more happen very often? The above chart looks at Gold Bugs Index (HUI) and looks at times...

by Chris Kimble | May 18, 2015 | Kimble Charting, Metals
CLICK ON CHART TO ENLARGE When it comes to buy and holding senior gold mining stocks (GDX), they have been a place to avoid for the past few years. The same is even more true of Junior Mining stocks (GDXJ), as its performance has even been worse over the past few...

by Chris Kimble | May 12, 2015 | Kimble Charting, Metals
If the stock market would happen to head lower in price, where would be a good place to hide? Another question could be, what area that has done poorly could be acting better? The table below looks at the S&P 500, Bond ETF (TLT) and Gold Miners ETF (GDX) over the...
