
In the summer of the 2011, a rare set up was in place in the Gold and Swiss Franc markets. At the time the Power of the Pattern shared that Gold should be “Down for years to come.” See why we shared this near all-time highs in gold (HERE)
Since that post, the metals complex has its worst 3-year declines in history!

CLICK ON CHART TO ENLARGE
We shared this table with Premium and Metals members at the first of this year. As you can see from the table above, Gold has just experienced its worst 3-year return in its history and Silver is not far behind, as it just experienced is 2nd worst 3-year decline in its history.
Are the hard times over for Gold & Silver? Has the trend changed for them?
The clear answer from the Power of the Pattern at this time is; the multi-year down trend remains solidly in play!
CLICK ON CHART TO ENLARGE
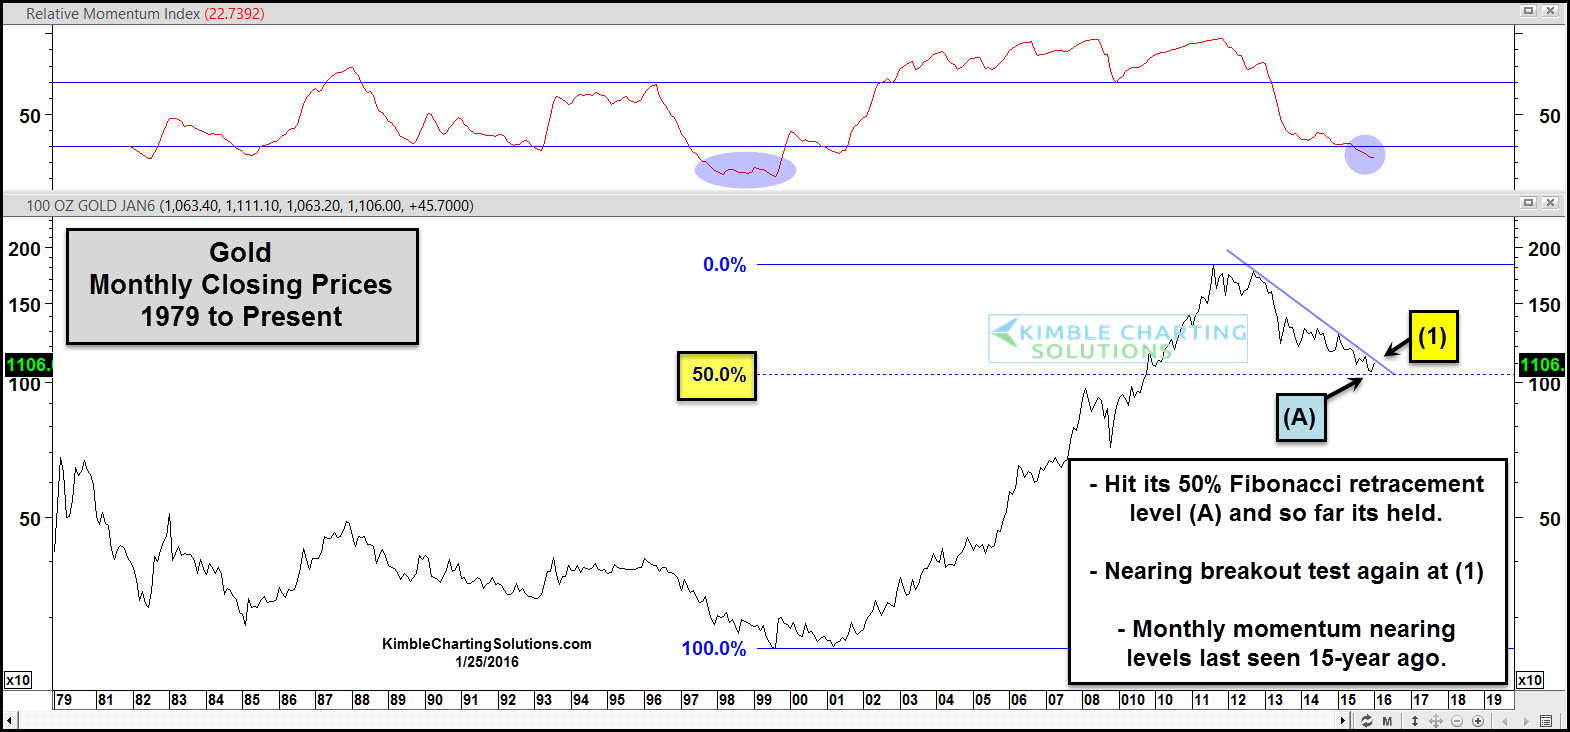
This chart looks at Gold on a “Monthly Closing” basis, back to 1979. The decline over the past few years saw Gold come down to its 50% Fibonacci retracement level of its 1999 lows and 2011 highs at (A) above. At the same time it is testing the Fibonacci level, monthly momentum is reaching oversold levels. Last time monthly momentum was this low was back in the late 1990’s.
At this time Gold is now within 1% of 3-year falling resistance at (1) above. No doubt the trend is down at this time. Gold is being presented with another resistance test, to break from its solid bear market trend at this time.
If Gold can take our falling resistance, it would be a first in years. Could become an interesting development in golds trend lower!
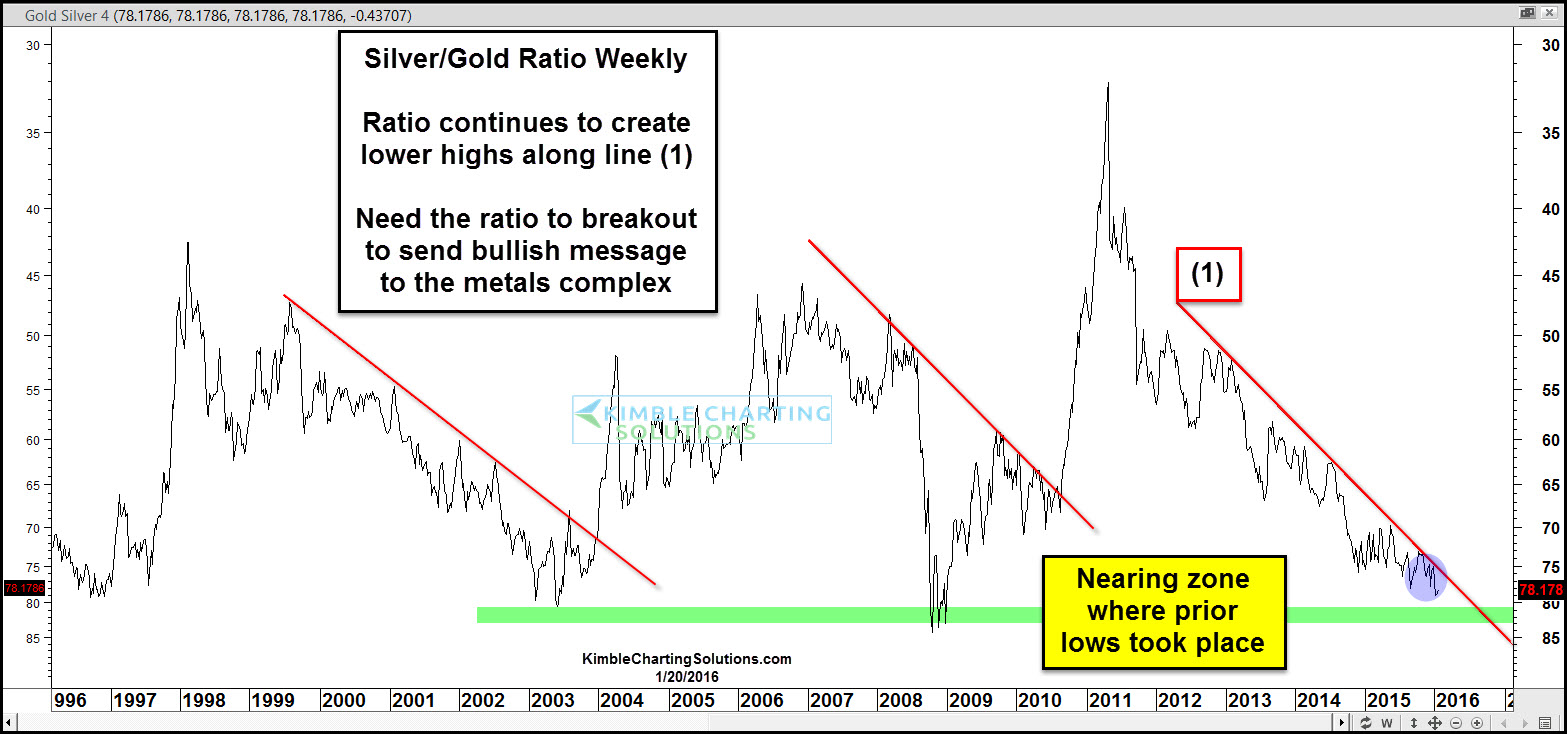
Another tool we share with Premium and Metals members each week is our Silver/Gold ratio (See Below)
CLICK ON CHART TO ENLARGE
We have shared with members the above chart for the past few years. This ratio compares the price of Silver to Gold. The ratio remains in a downtrend for sure, as it continues to create a series of lower highs, below falling resistance line (1). The ratio is nearing the lows it hit three different times over the past 20-years.
Bottom line…Metals remain in a downtrend. Gold and the Silver/Gold ratio are both facing key falling resistance tests at this time. If Gold and the Silver/Gold ratio break falling resistance, the potential for a counter trend rally increases by a good deal.
–

The chart is interesting. Quickly glancing on it, looks like there are 7-8 years between beginning pivot low and pivot low before cycle breakout. If that holds true this time, then it would be more like 2017-2018 before cycle reversed. My analysis has been that precious metals likely remain in a decline until 2019 or later before they move sideways to higher.