
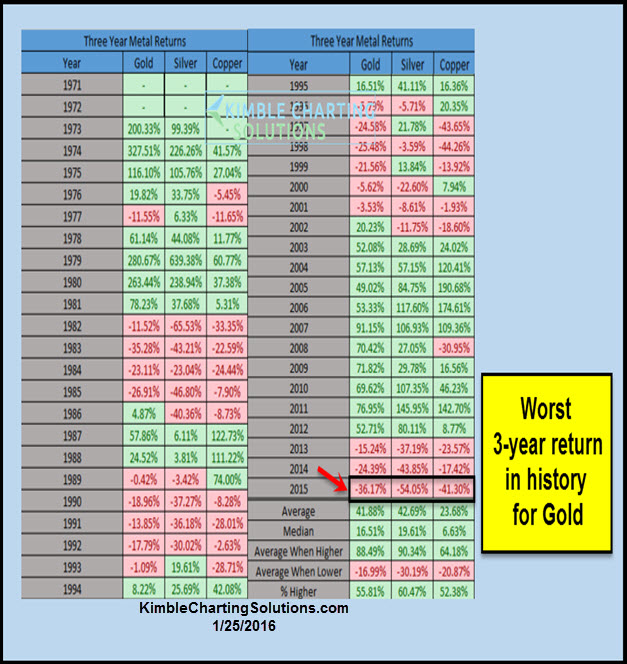
It’s been a rough 3-years for the metals space.
“THE” worst 3-years in history for Gold and the 3rd worst 3-year performance in history, for Silver (see table below). The Power of the Pattern shared in 2011, that metals should be down for years to come. (See post here)
Is the trend about to turn for metals? Below we discuss what we are looking at, per breakouts in Gold & Silver.
CLICK ON CHART TO ENLARGE
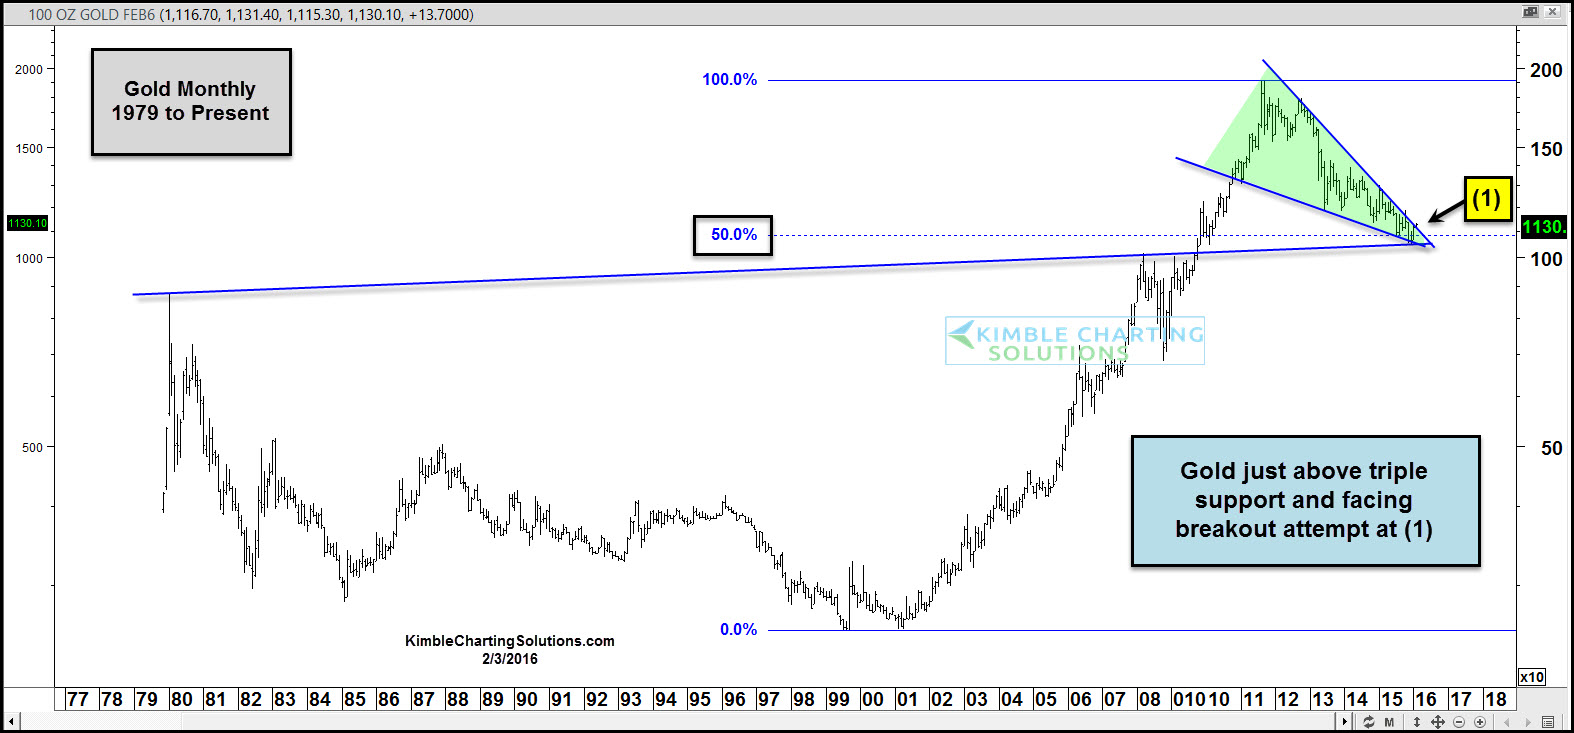
Below looks at the current price pattern in Gold
CLICK ON CHART TO ENLARGE
Let’s be clear about this; The trend in Gold and Silver is down and if support would break at (1), the current trend continues.
This Power of the Pattern situation has my attention; The large decline since the 2011 highs, took Gold down to test triple support of late, at the bottom of this bullish falling wedge. It has paid to “Sell or Short Gold” at falling resistance for the past 3-years and resistance is being tested again, at (1) above.
Will it be different this time???
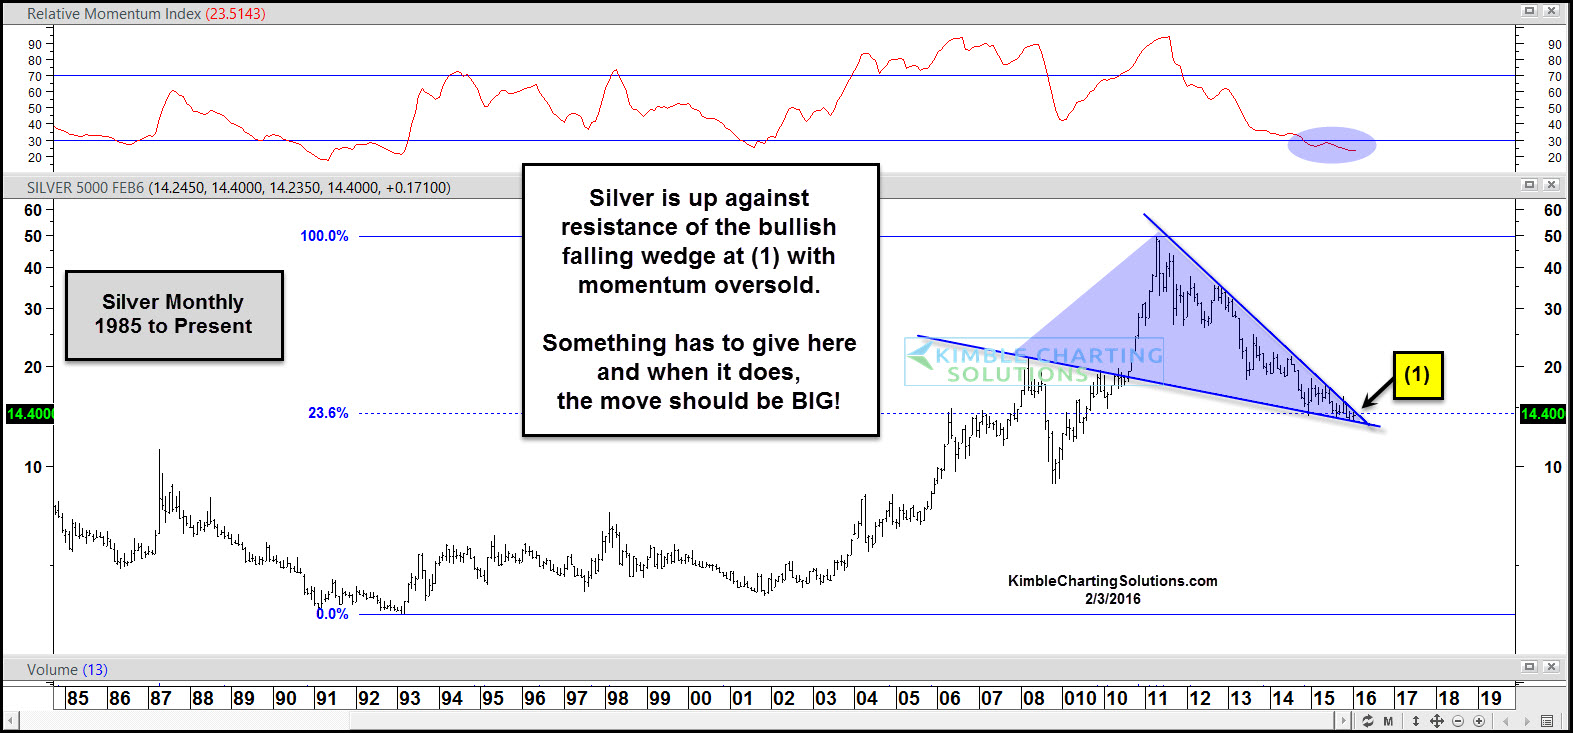
Gold is not alone in testing support at this time. Below is an update on Silver.
CLICK ON CHART TO ENLARGE
Gold and Silver conditions; Both are testing several support lines, at long-term Fibonacci retracement levels, with momentum oversold, at the apex of bullish falling wedge patterns.
Something has to give friends and when it does, it has the potential to be BIG!!!
I humbly feel the opportunities in the space, are huge, in both directions. Movement is your friend in either direction and it appears, and the stage is set for some BIG movement.
If the metals space is of interest to you, I would be honored if you were a metals member.
Our weekly metals reports is just $29 per month (sign up here) and we pass along a 20% discount for annual membership (sign up here)
–

I currently subscribe to metals & pay $29 monthly. I would like the 20% discount for yearly. Thx