
CLICK ON CHART TO ENLARGE
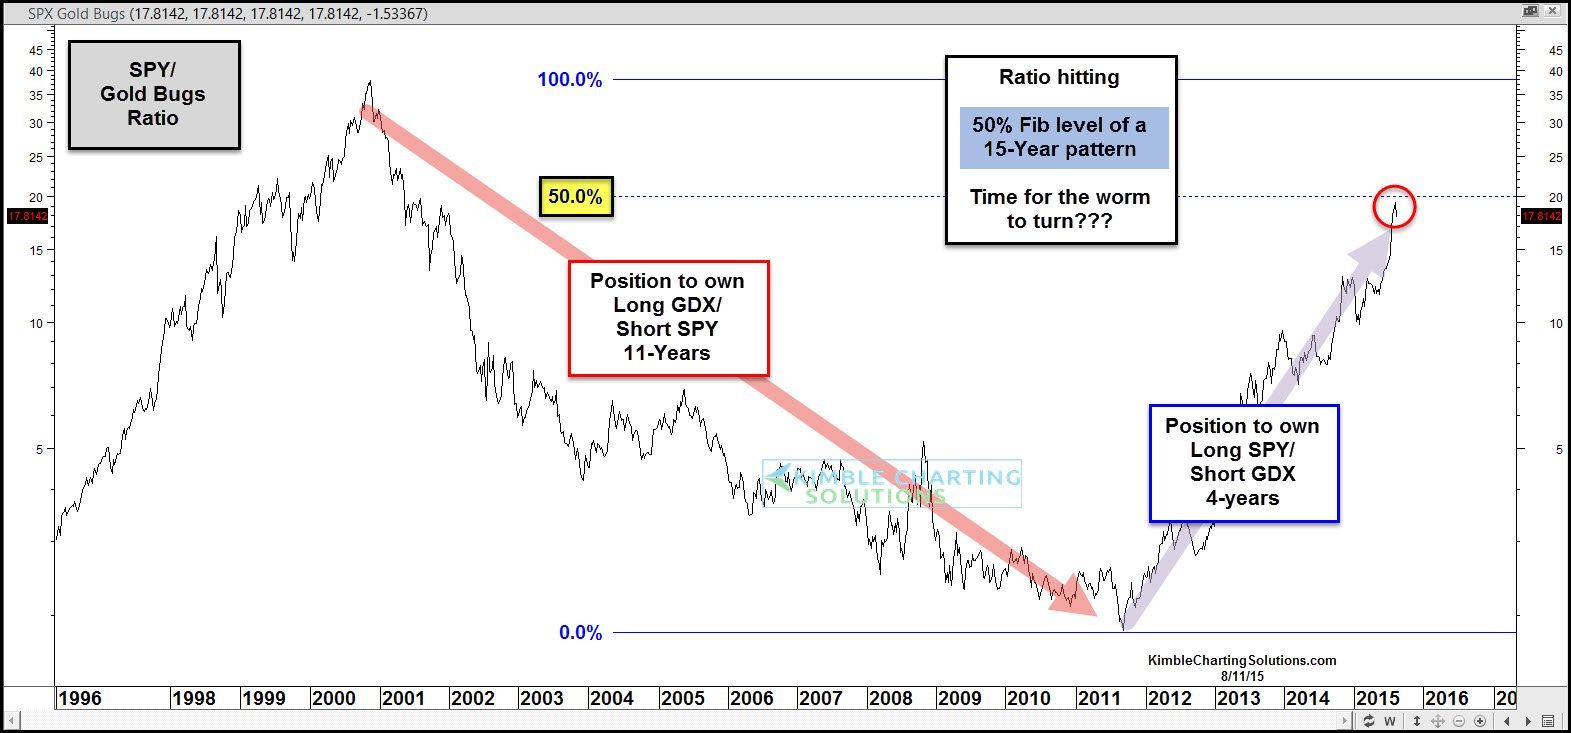
This chart looks at the S&P 500/Gold Bugs (HUI) ratio over the past 20-years.
The ratio fell for almost 11-years (2000 to 2011), meaning it paid to be long gold miners and short the S&P 500 in a big way during this time frame.
Over the past 4-years, it’s paid to be long the S&P and Short miners (2011 to 2015) in a big way, as the ratio has skyrocketed for the past 4 years!
Now the ratio is hitting the 50% level of the 11-year decline from 2000 to 2011.
It is time again to Long the miners and short the S&P 500 as a pair trade again? I will be discussing this and several other key situations in the metals and miners complex that I haven’t seen many times in the past 15-years later today.
If you are interested in this type of analysis, you might want to become a Metals Member, which costs just $29 per month to join. We also pass along a 20% discount for annual members and even larger discounts for Triple Play Members.
Research and Sign up details can be found by clicking HERE or below

–
