
 CLICK ON CHART TO ENLARGE
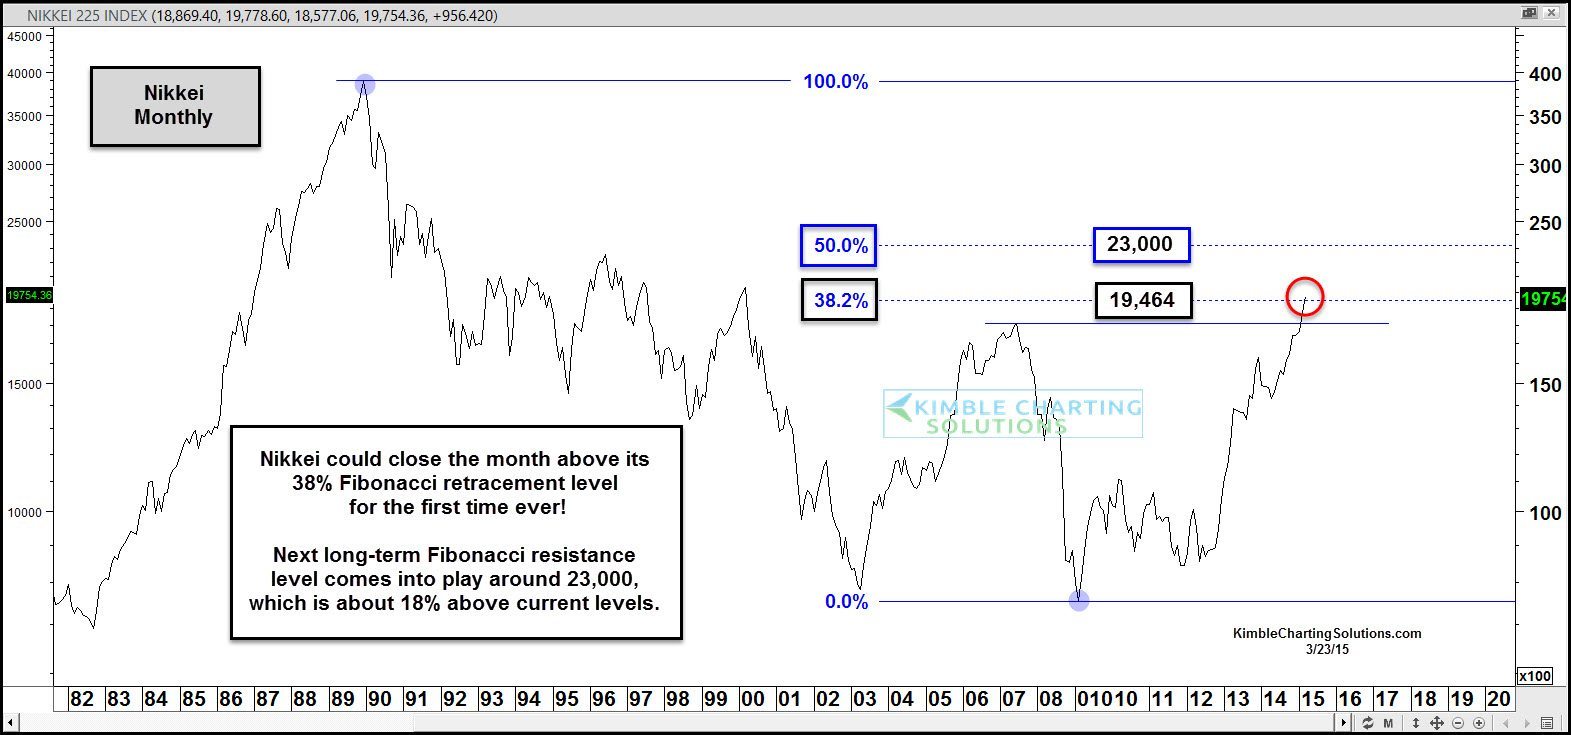
The S&P 500 is near all-time highs. The Nikkei 225 can not say the same thing, as its remains nearly 50% below its monthly closing high back in 1989. This year, the Nikkei is doing much better than the S&P 500, up 10% more and it is attempting a breakout of a key long-term Fibonacci retracement level.
The above chart looks at the Nikkei on a monthly closing basis since 1982. I applied Fibonacci to the 1989 highs and the 2009 lows and the 38% Fibonacci resistance level comes into play around the 19,464 level. The month is not over with at this time, should it close the month above this level, it would accomplish something for the first time ever.
Should the Nikkei close above the 38% Fibonacci level, the next Fib extension level comes into play around the 23,000 level, which is nearly 18% above current prices. The Nikkei isn’t the only key asset in Japan that is testing an important level.
 CLICK ON CHART TO ENLARGE
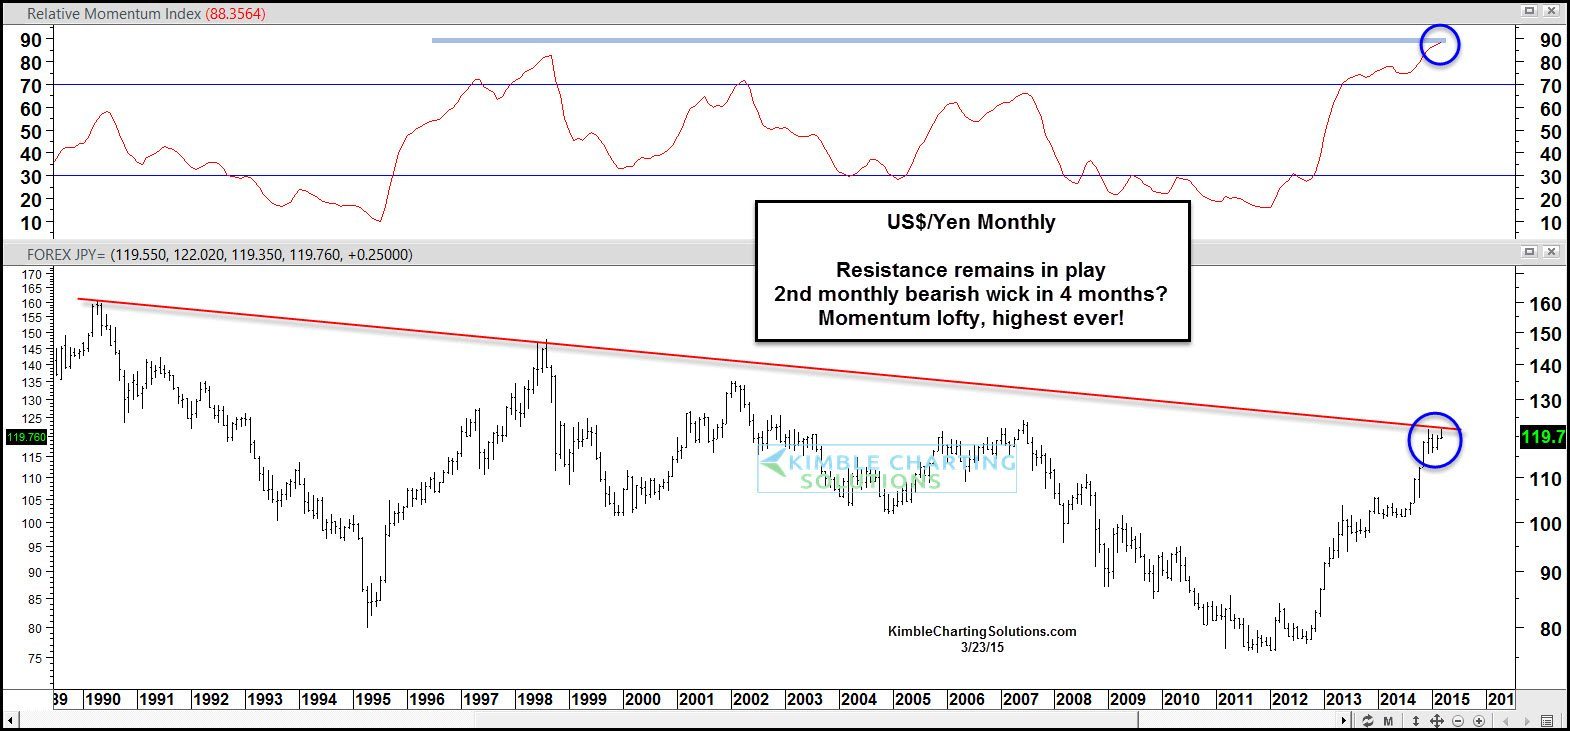
The U.S. Dollar has been very strong compared to the Yen over the past few years. The strong rally now has it facing falling resistance that has been in play since the last 1990’s, with momentum hitting the highest monthly momentum levels ever.
The month has another week before its over and the US$/Yen could be creating a bearish wick at this resistance level.
These charts reflect that the Nikkei and US$/Yen are both facing key long-term levels at this time. What the Nikkei and US$/Yen do at these levels could well have a big impact going forward. Keep a close eye on these markets next week, to see if key monthly closing levels are accomplished.
Click this button to see details on our Global Dashboard research reports-

–
