
 CLICK ON CHART TO ENLARGE
The chart above looks at Corn over the past 30-years and applies a 2-year rate of change to it. Over the past two years, Corn is down around 45%, been a rough go of it for sure! Could that lead to future opportunities?
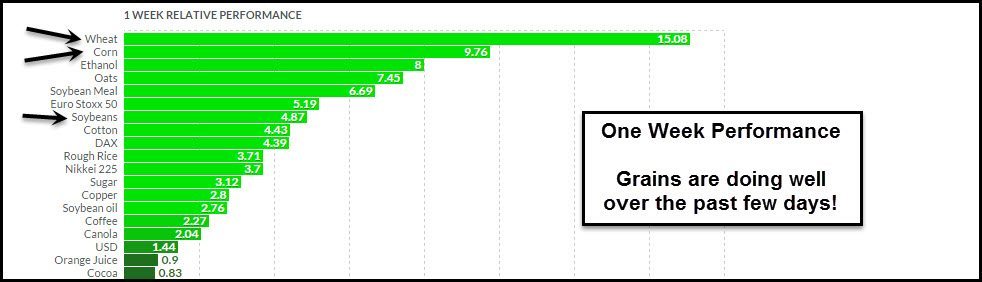
Below looks at the best performing assets over the past week,(calculated at 8:30 central this morning)
CLICK ON CHART TO ENLARGE
If you like the idea of buying low and selling higher, one might want to look at the chart below.
 CLICK ON CHART TO ENLARGE
Joe Friday just the facts….One week DOES NOT make a trend.
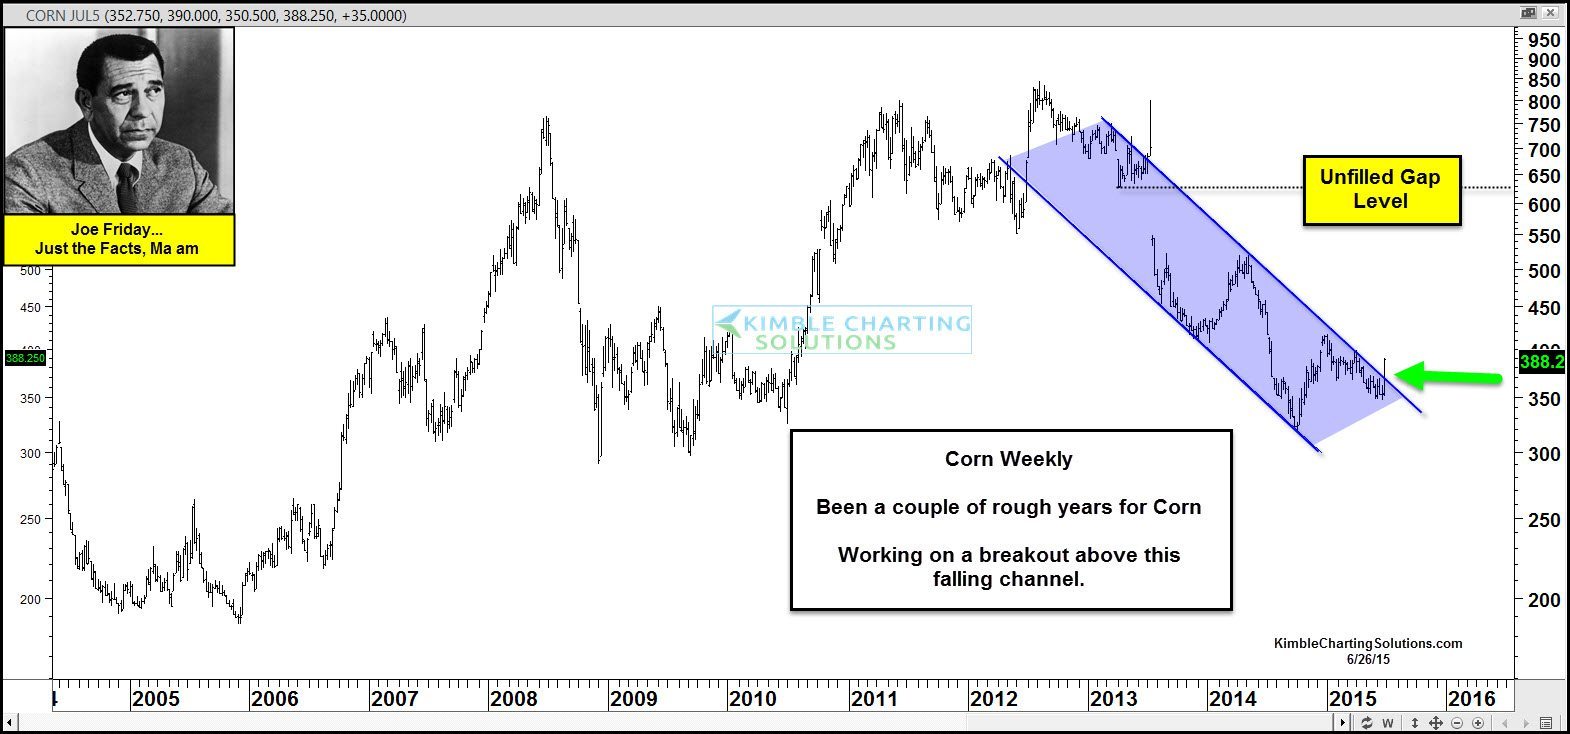
At this time, Corn futures look to be working on a breakout of a 2-year falling channel, which is a positive for them. Corn now looks to be testing the top of a pennant pattern at this time. Should it break above this level, it could attract more buyers.
A large unfilled weekly gap remains just above the $6 level. “IF” Corn would fill this gap, some big gains would take place!
The Power of the Pattern covers grains in the Sectors/Commodity Sentiment Extremes Report…

–
–
