
CLICK ON CHART TO ENLARGE
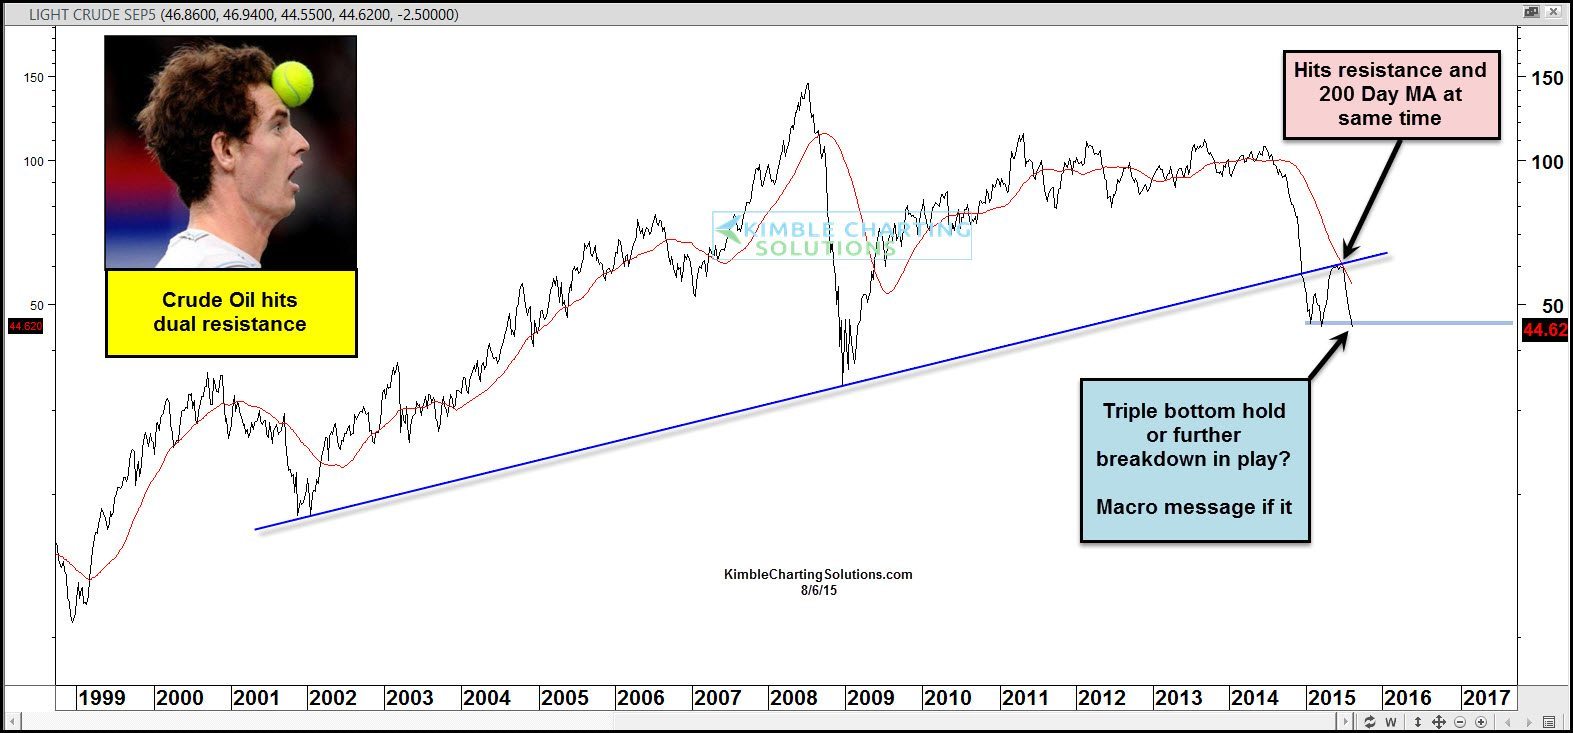
Is Crude Oil on its way to much lower prices? A year ago Crude Oil started a bear market, as it broke below multi-year support, taking it below a support line that has been in play for the past 7-years.
After a 50% decline, a counter trend really took Crude to the underside of resistance and its 200 Day moving average (highlighted above), where it stopped on a dime. Since hitting resistance, Crude Oil has declined over 15% in the past month.
Now Crude is testing lows established earlier this year. Is a triple bottom in play or is a further breakdown about to take place?
If Crude doesn’t hold at support, would it be sending a supply/demand message or is it suggesting something bigger is taking place on a macro basis?
Humbly I am of the opinion, Crude Oil is one of the more important commodities on the planet and what it does from here would be suggesting something about the global economy, which could ripple into the stock market.
Our Global Dashboards report keeps “Slow Money Managers” on top of this Crude situation on a weekly basis. If you are interested in this type of research, becoming a member might be of benefit and value to you.
Click Below for Dashboards sign up details

