

CLICK ON CHART TO ENLARGE
The Dow formed what looks like a long-term “Megaphone” pattern in the late late 1960’s to early 1980’s.
When it took out overhead resistance of the megaphone pattern in the mid 1980’s, it pretty much never looked back.
Last summer, the Dow broke above resistance based upon the 2000 and 2007 highs, which was a positive from a technical point of view.
The decline of late took the Dow below support line (A) and now its kissing it as resistance at (1) above.
Is this pattern scaring people? Yesterday we shared that investors were betting big time on a “Black Swan” event right now. (See Post Here)
The broad markets remains inside of uniform 5-year rising channels, support remains in play around the world, reflected in the 6-pack below
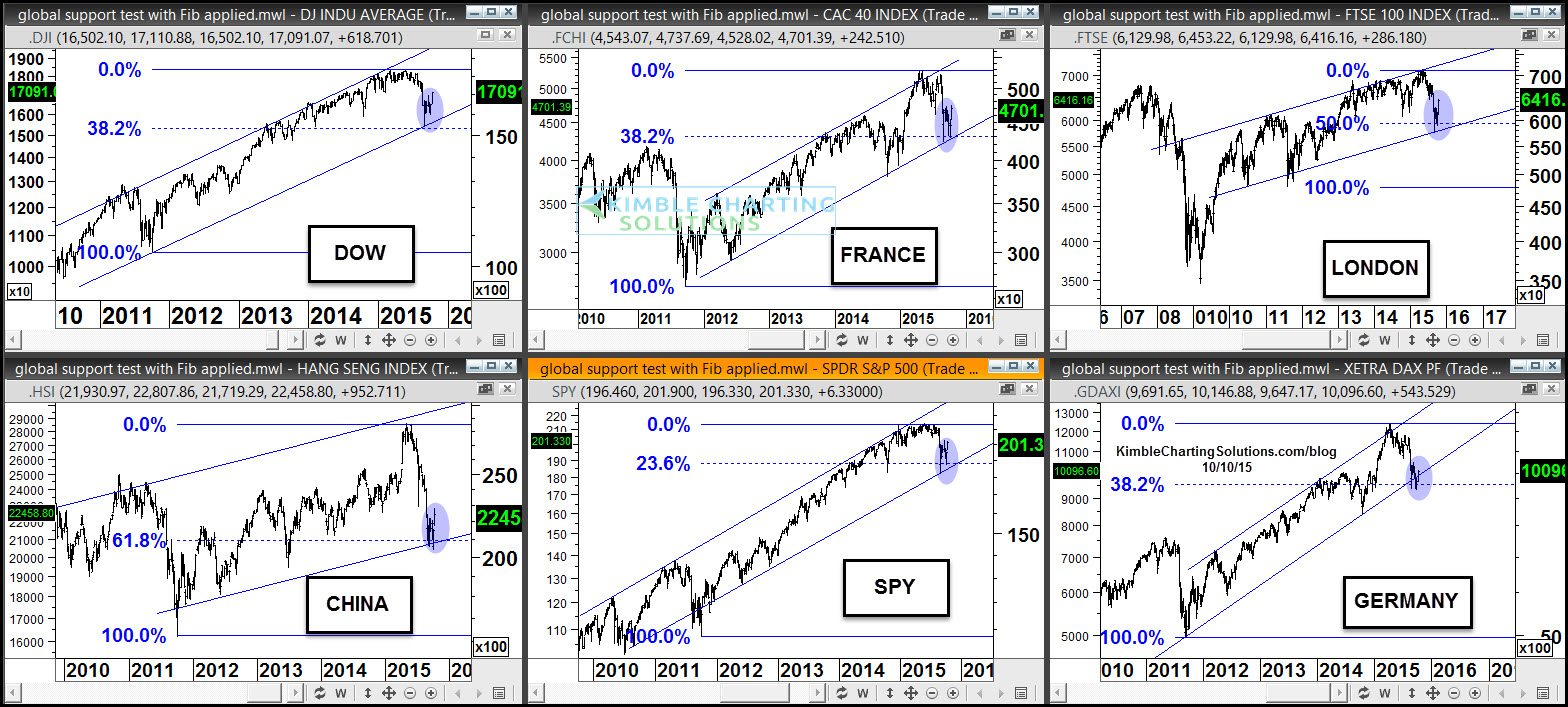
CLICK ON CHART TO ENLARGE
The take away from this 6-pack is this….Markets around the world have experienced short-term declines in longer-term rising channels. Each markets decline of late
took it down to 5-year support, where each of these markets created reversal patterns at Fibonacci retracement levels.
I’m not so sure what has options players betting on a “Black Swan” event at this time.
What would have me concerned is this, if the Dow finds the underside of the megaphone pattern to be “mega resistance” and in turn 5-year rising support breaks.
Right now support is support and until it breaks, it would appear option players might be wasting some money on put options, until support gives way.
If you would like to stay abreast of the price action in our global 6-pack above, you might want to be a Global Dashboards member.
—
