CLICK ON CHART TO ENLARGE
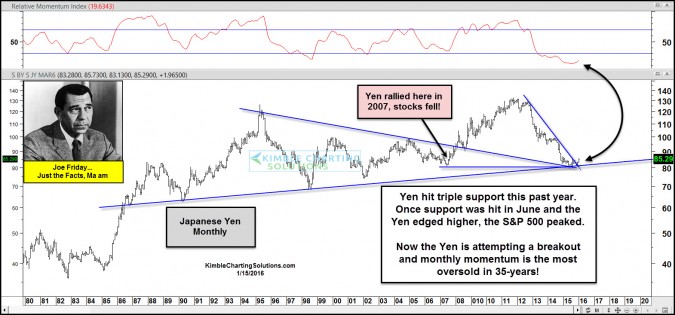
We have been sharing the above chart with our Premium, Global Dashboard and Sector members, for the past few months. This chart looks at the Japanese Yen over the past 35-years.
In 2007, the Yen took off and stocks around the world tanked.
The Power of the Pattern has been highlighting for months, that 20-year and 30-year support lines were both meeting at the same price point last year. At the same time the Yen looked to be creating a bullish falling wedge.
Due to the decline in the Yen over the past few years, monthly momentum is hitting levels NEVER seen in the past three decades (most oversold ever)
Joe Friday just the Facts...The Yen is attempting to break above falling resistance, after testing triple support. History would suggest that if the Yen takes off from here, stocks are in trouble!
Keep a close eye on what the Yen does from here friends, this could be a BIG DEAL!!!
See more about our membership options HERE
–


