
Gold Mining stocks started off the year like a rocket ship. Over the past 20-weeks, the popular Gold Miners ETF (GDX) has declined nearly 35%. This is one of its larger 20-week declines in its history! Create an opportunity? We think so!
This decline has the Gold Bugs Index (HUI) at a rare price point in the chart below.
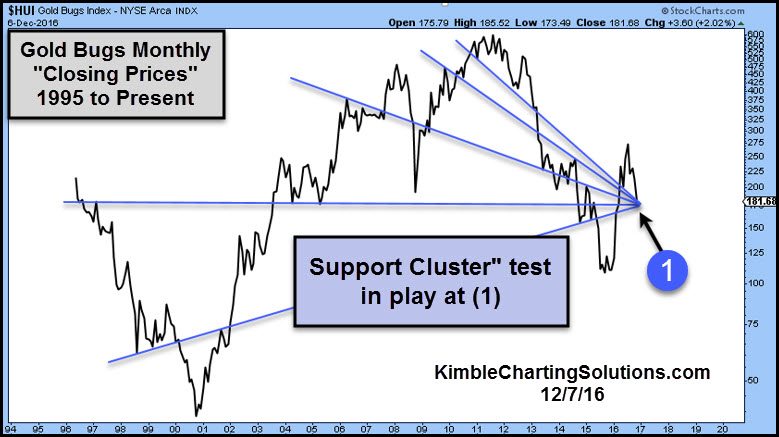
CLICK ON CHART TO ENLARGE
This Gold Bugs chart is based upon “Monthly Closing Prices” over the past 20-years. The Power of the Pattern reflects that a series of support and resistance lines are in play as a “Support Cluster” at (1) above.
This is a key support test for miners, that have declined nearly 35% of late. If a miners bounce is to take place, this is a place where it can get started! One of the most influential currencies that impact Gold and Miners a ton, is the Swiss Franc. In 2011, the Power of the Pattern suggested that “Gold would be Flat to Down, for years to come due to the pattern in play in the Franc. The pattern in 2011 was big time important for the metals space and we humbly feel where the Franc is now, is just as important as then!
For this trend to change, Gold and Miners to break long-term down trends, what the Franc does right now (testing 15-year support), will send critical clues about the future of Gold, Silver and mining stocks.
If you are interested in Power of the Pattern analysis on Gold, Silver or mining stocks, we would be honored if you were a Premium or Metals member.
