

Below takes a look at the S&P 500/Gold Bugs Ratio over the past 20-years. The ratio fell for nearly a decade, as miners were tons stronger than the S&P from 2001 until 2011. Over the past 6-years, the opposite has been true, as the S&P has been the place to be over miners.
Is the trend about to change? Is a major topping pattern completed? Check out the ratio below.
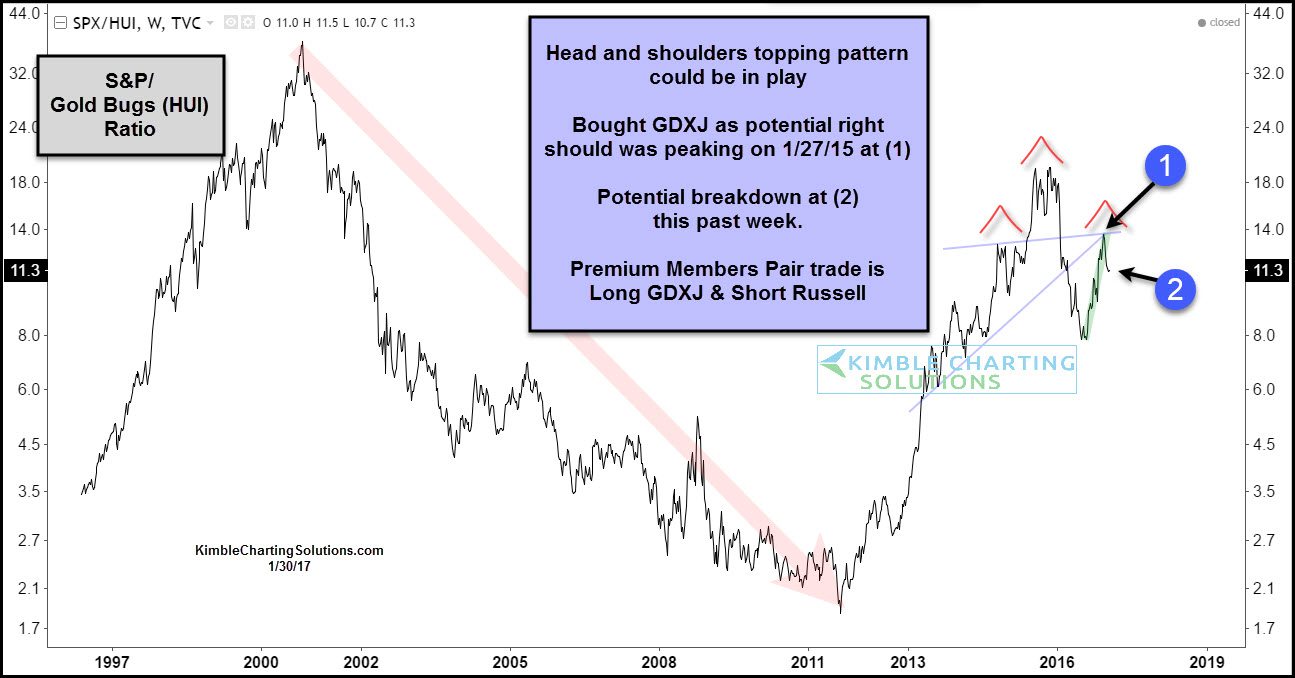
CLICK ON CHART TO ENLARGE
The trend in the ratio has been up since the lows in 2011. Potential that a reversal pattern (bearish Head & Shoulders top) is in play.
Premium Members bought GDXJ at (1) and also own the Inverse Russel ETF (RWM), forming a pair trade of Long Junior miners and Short Junior Stocks.
Could Gold Bugs (Miners) out perform the S&P for years to come? We shared this idea on 1/5/207 HERE
