
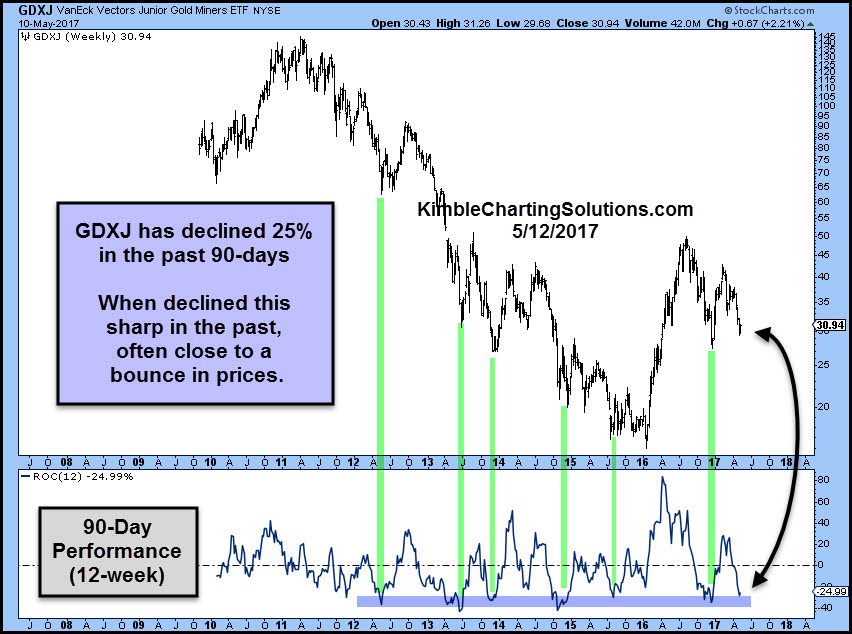
 Junior Miner ETF (GDXJ) has had a rough go of it the past 90-days. Could that large decline, present an opportunity? Below looks at the performance of GDXJ over 90-day windows since its inception.
CLICK ON CHART TO ENLARGE
GDXJ has fallen nearly 25% over the past 90-days. When GDXJ has been down this hard in a 90-day window, even during a bear market, it was closer to a short-term low than a high. Below looks at the chart pattern of GDXJ and the GDXJ/GDX ratio.

CLICK ON CHART TO ENLARGE
Joe Friday Just The Facts– The large decline and the two charts directly above reflect that GDXJ was presenting a entry point, where a rally could take place.
Both of these charts were shared on Wednesday with Premium and Metals members. We would be honored to have you as a member, if these type of patterns are of interest to you.
