

Coffee has been rather cold the past few years, as Coffee ETF (JO) has declined from $80 back in 2011 to $15 of late. This decline has created a interesting Power of the Pattern setup and drove away most bullish investors in Coffee.
Below looks at Coffee ETF JO and the pattern it has been making the past few years-
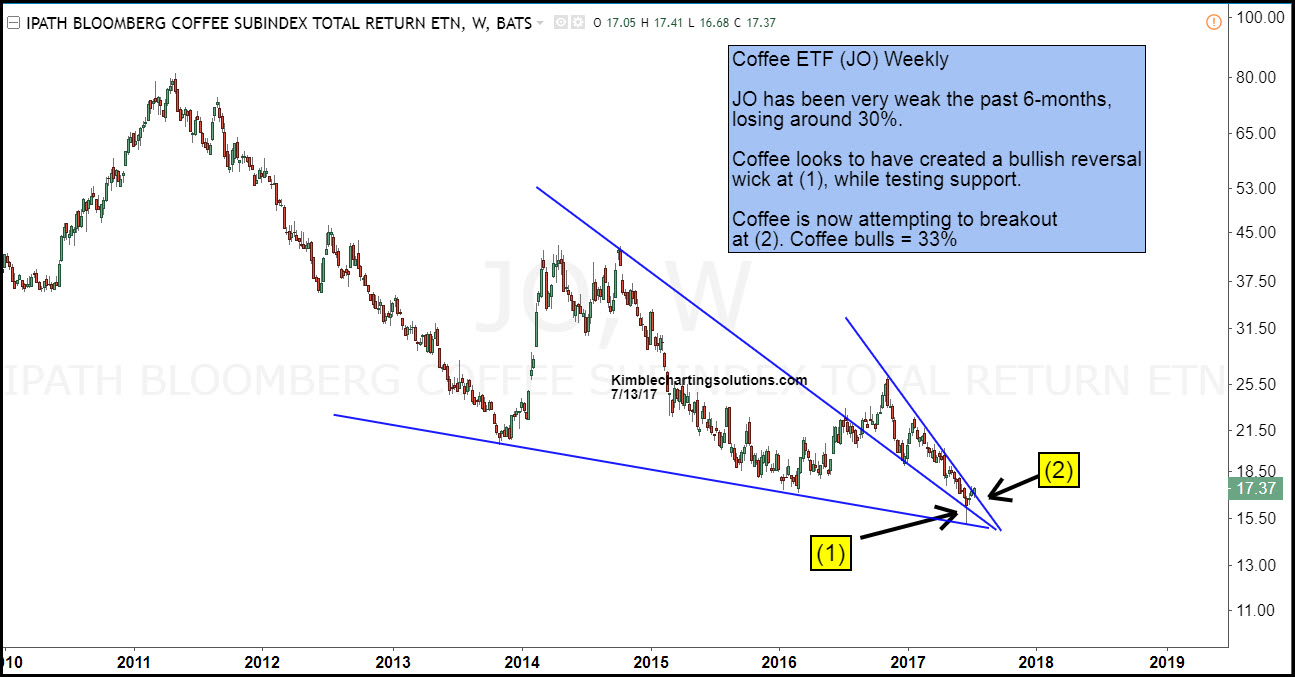
CLICK ON CHART TO ENLARGE
No doubt the trend in Coffee is down at this time. As mentioned above, JO looks to have hit support of a bullish falling wedge at (1), where it created a rather large bullish wick (reversal pattern) a couple of weeks ago. A small counter trend rally has taken place the past couple of weeks and now JO is testing resistance of the bullish falling wedge at (2).
If Coffee would happen to breakout, it could create a short covering rally as traders have amassed the most lopsided/crowed trade in the history of Coffee futures.
We have been sharing this pattern with Premium and Sector members over the past 6-weeks. If you would like to receive charts like this on a daily or weekly basis, we would be honored if you were a member.
