

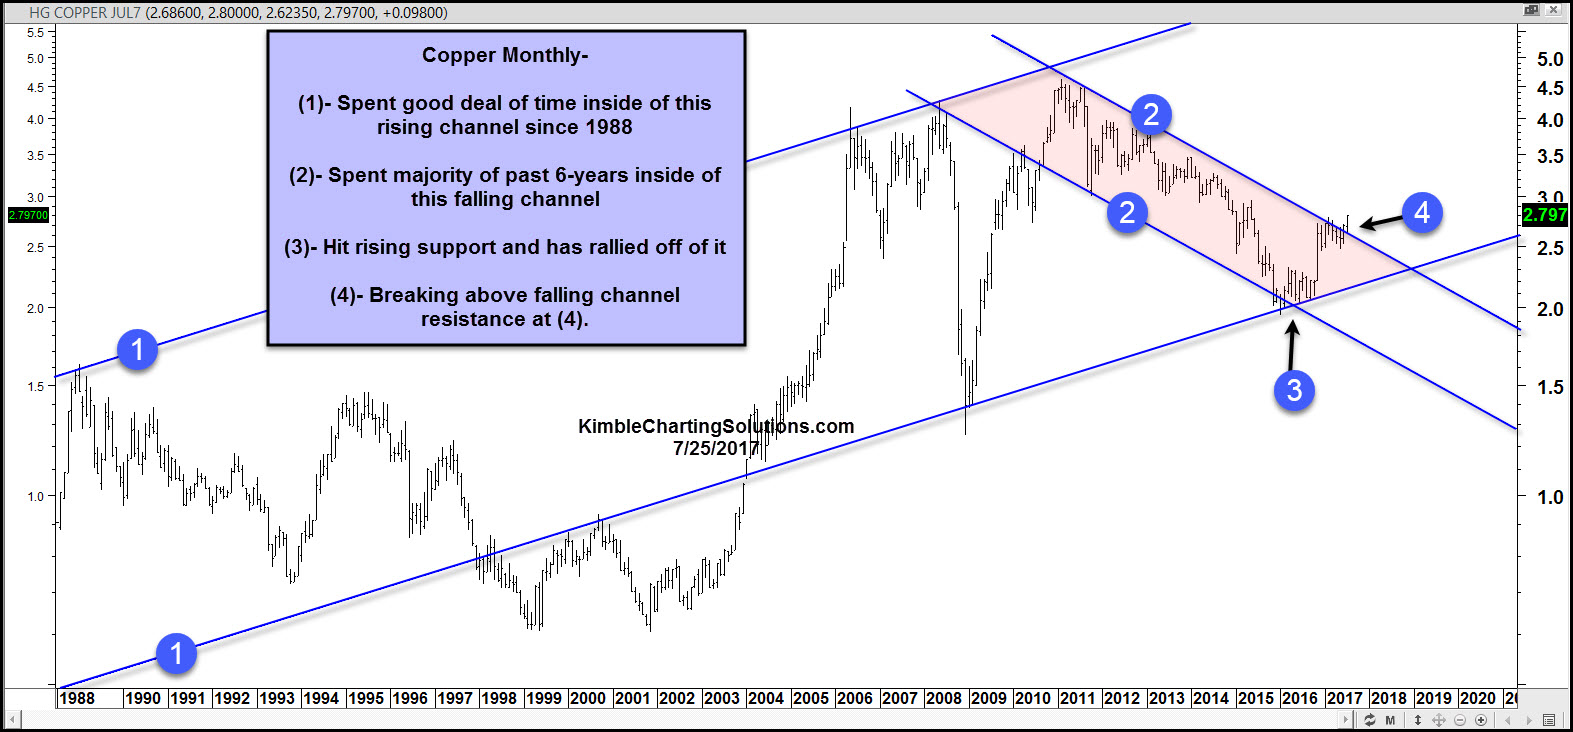
Below looks at Copper Futures on a monthly basis, since the late 1980’s. A good deal of the past 30-years, Doc Copper has remained inside of rising channel (1), reflecting that the long-term trend is up. The top of this channel was hit back in 2011 and since then, Doc Copper has created a series of lower highs inside of falling channel (2).
CLICK ON CHART TO ENLARGE
Before the election last year, Copper hit rising support at (3) and spent a good six months testing this support. After support held for a good length of time, a rally then took place, pushing it up to test the top of falling channel resistance.
Of late, Doc Copper is breaking above 6-year falling resistance at (4), which historically is a positive sign for Copper. Positive sign for other companies in the industry? Sure could be.
The Power of the Pattern has liked the looks of Doc Coppers chart for a good while. Due to the pattern, Premium and Metals members bought Freeport McMoran (FCX) two months ago. So far FCX is up over 10% and has been much stronger than the broad market.
