

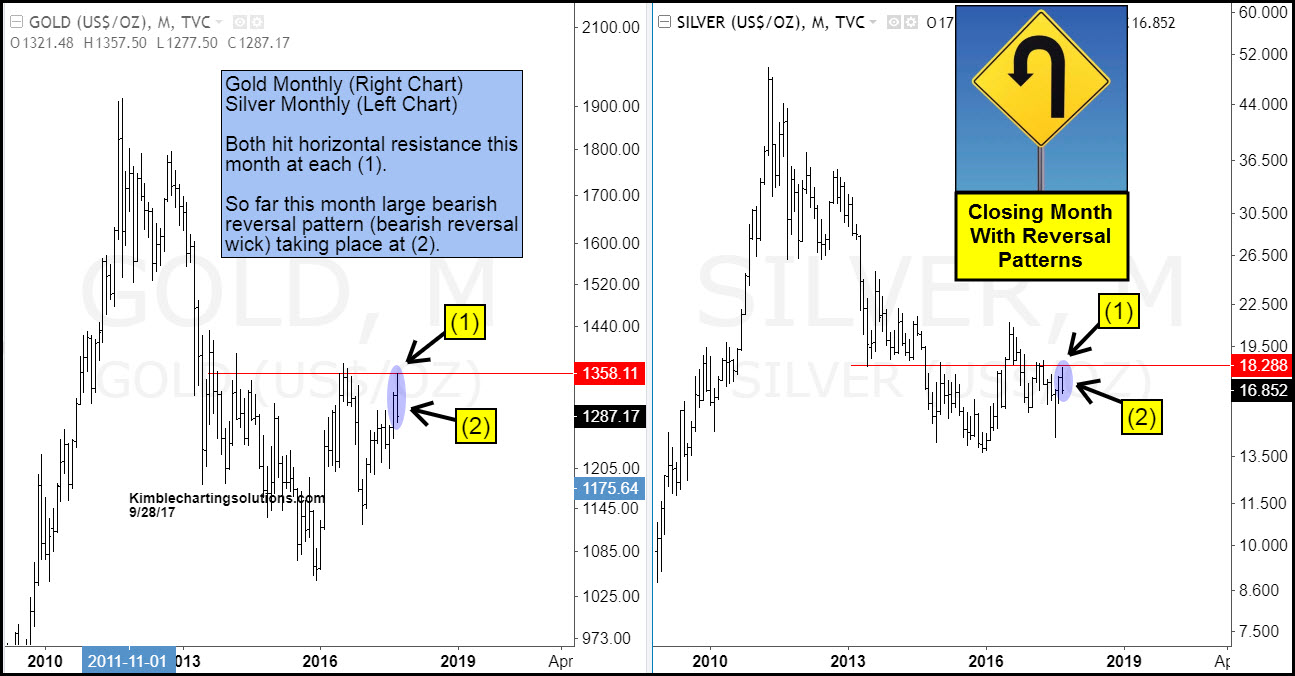
Below looks at Gold and Silver patterns on a “Monthly basis” over the past 7-years. The rally in Gold and Silver since early 2016, has taken both of them back to test levels that were heavy for each of them over the past few years.
CLICK ON CHART TO ENLARGE
Joe Friday Just The Facts Ma’am– Gold and Silver created “Monthly Reversal” pattern this month at each (2), just under key overhead resistance at (1). These monthly reversals are the largest monthly reversals for both metals in the past few years.
One-month reversals at resistance in time could be concerning to Gold & Silver bulls. A one-month reversal pattern doesn’t prove that the 18-month rally is over. The reversal pattern could be something to pay close attention too, since Gold and Silver traders have created crowded bullish trades, as resistance tests are in play at each (1).
Metals bulls would LOVE to see both break out at (1). If you would like to stay abreast of these patterns in Gold & Silver, we would be honored if you were a Premium or Metals members, as we keep both of them updated each week on these patterns.
