

Year to date, Small and Micro Caps stocks don’t have a ton to brag about when compared to the S&P 500, as both are lagging by several percentage points.
Below looks at the performance of them to the broad market over the past 30-days, which reflects that both of them are much stronger of late.

CLICK ON CHART TO ENLARGE
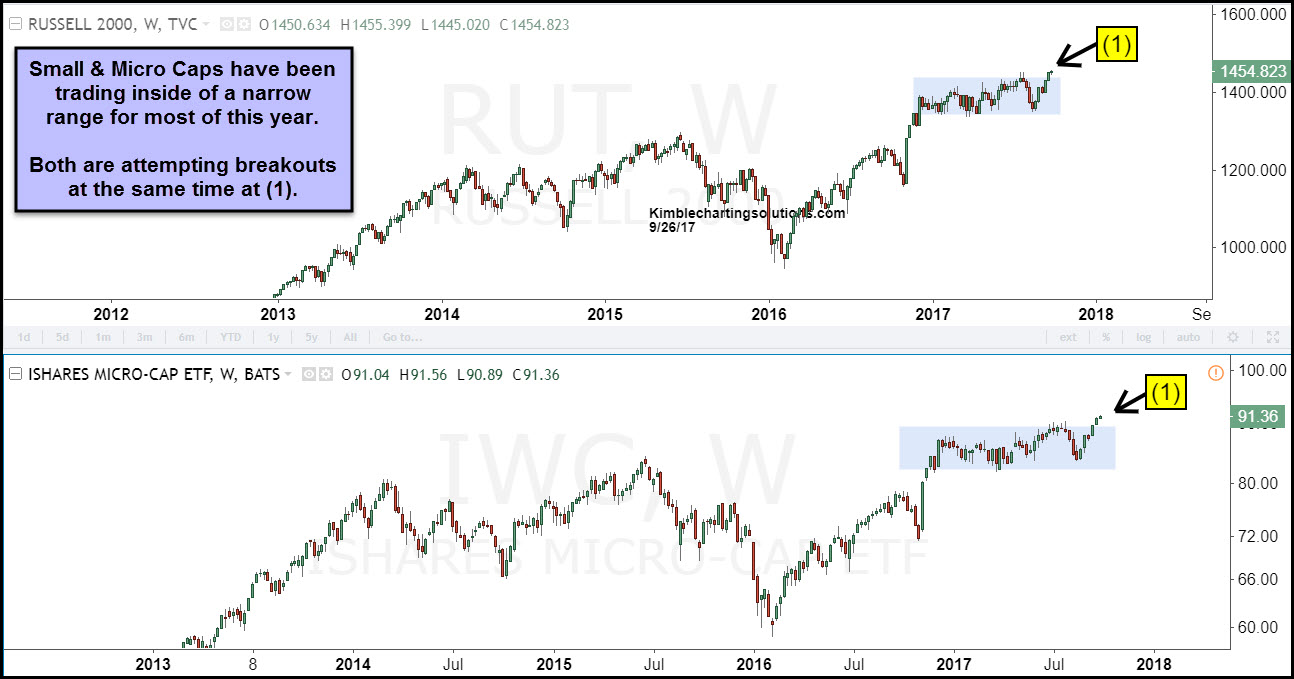
Small Caps and Micro Caps have been creating look-alike patterns for the past few years, reflected in the chart below-
CLICK ON CHART TO ENLARGE
Both are attempting to break out of a sideways trading range of late at (1). Potential that both have created a base over the past 9-months, to push higher off of.
The price action of late is positive for both and could send a positive message to the broad market as well. Stock market bulls want to see a breakout continue. They would get caution message of both would get back into the blue shaded trading range.
This chart is updated weekly to Sector and Premium Members.
