

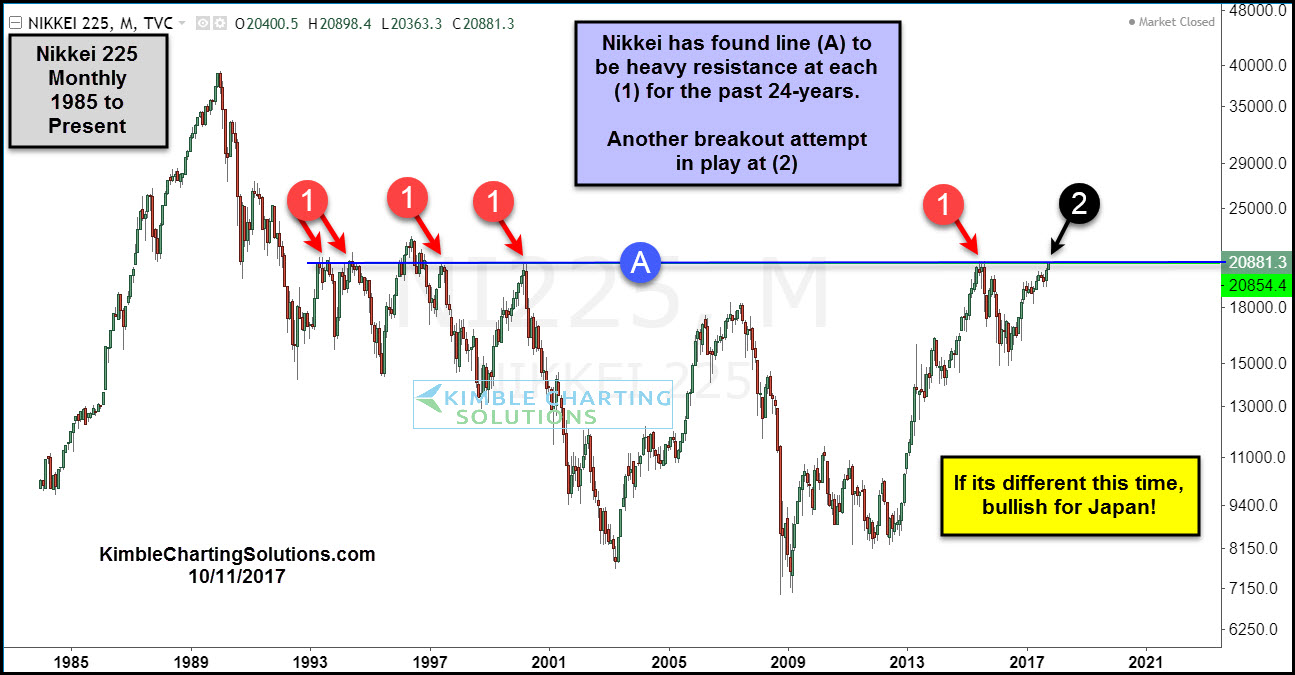
The Nikkie index has found a certain price level very tough to break free from for the past 24-years. Below looks at the Nikkei index on a monthly basis for the past 30-years.
CLICK ON CHART TO ENLARGE
Line (A) comes into play around the 20,900 level. Since the early 1990’s, the majority of the time it hit line (A) at each (1), the Nikkei ended up creating an important high. Five different times, the Nikkei has hit this level at (1) and peaked. These peaks were important to the Nikkei and indices around the world.
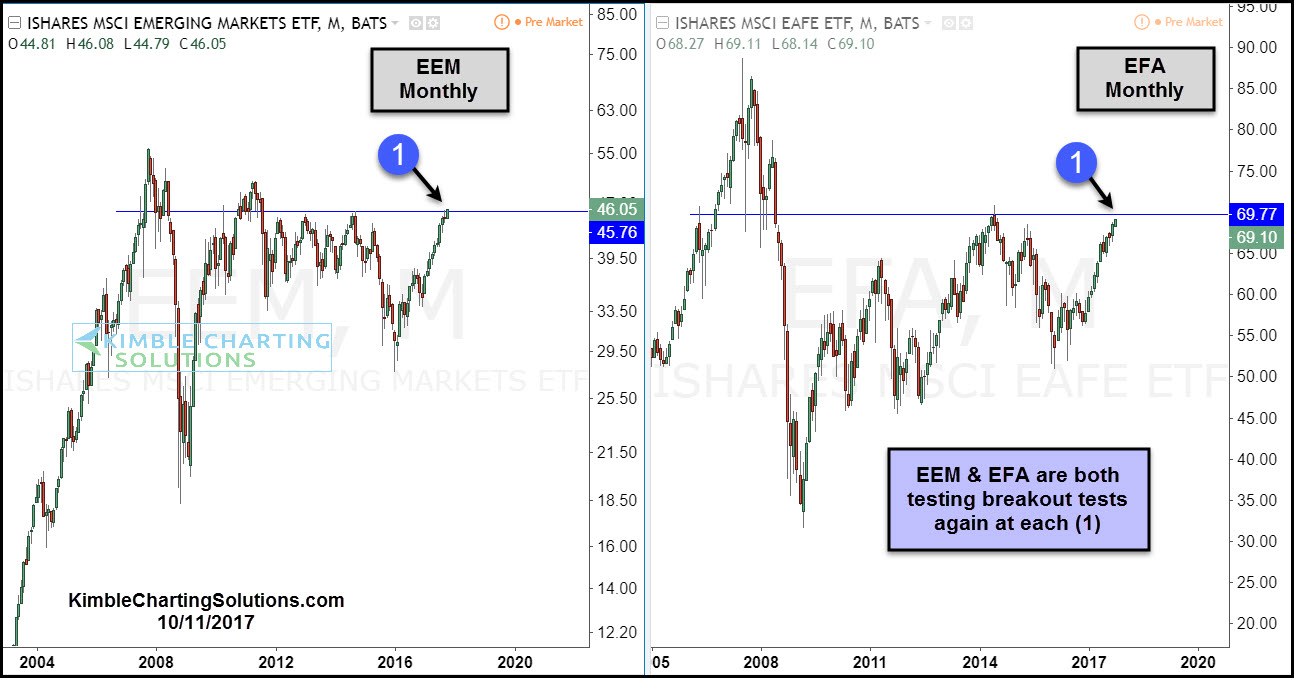
At the same time the Nikkei is testing long-term horizontal resistance zone, EEM and EFA are doing the same.
CLICK ON CHART TO ENLARGE
What the Nikkei, EEM and EFA do at these important breakout levels, will be important to each of these assets and the broad markets in the states. If October is to repeat as a strong seasonal month again, upside breakouts in these key assets need to take place.
