

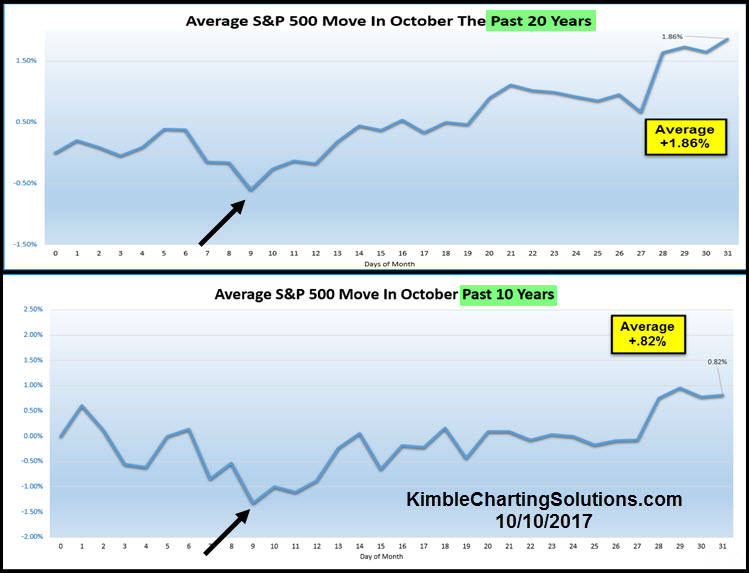
Below looks at the average performance of the S&P 500 in the month of October, over the past 10 & 20-years. Both charts have a couple of things in common.
CLICK ON CHART TO ENLARGE
The first thing that each chart has in common is that both charts reflect gains in the month of October, with the average gain over the past 10-years being +.82%.
The other thing that both charts have in common is the seasonal low over the past 10 & 20-year took place around the 9th of October, which was yesterday. The average gain in both charts from the 9th through the end of the month is around 1% larger than the average October gain.
Each month we share with Premium and Sector members, the 20 S&P 500 stocks that have done the best in each month, over the past 10-years. This month (October) reflects that the top 20 stocks average much greater gains than the overall markets! If you would like to take advantage of the October seasonal pattern and the 20 stocks that do well in October, we would be honored by your membership.
