

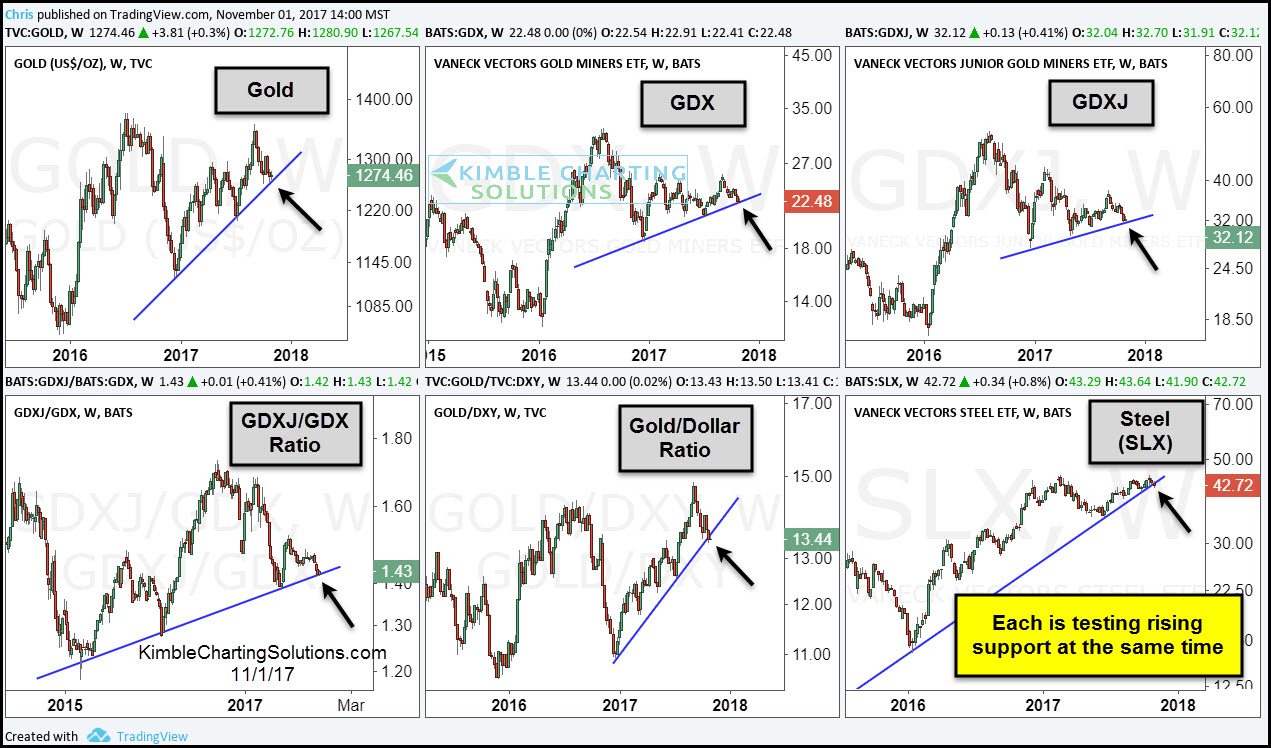
The 6-pack below looks at several charts in the metals sector (Gold, Gold Miners, and Steel). Each looks to be facing something similar at the same time.
CLICK ON CHART TO ENLARGE
Each asset or ratio above has something similar in play in the short and long-term. In the short-term, each is in an uptrend over the past couple of years (series of higher lows). In the long-term (since 2011 highs), each is in a downtrend (series of lower highs).
Each asset or ratio above is testing support at the same time and support is support until broken.
Metals bulls do not want to see these support lines to break, as the long-term trend (6-years) remains lower. The Power of the Pattern is of the opinion that what metals do at these key support lines, will send important short-term and long-term messages, as traders have positioned themselves for a big move in the near future.
If you would like to stay on top of the patterns, we would be honored if you were a Premium or Metals members.
