

One of our favorite patterns during a bull market is the ascending triangle pattern, especially a multi-year ascending triangle. On October the 12th the Power of the Pattern shared the chart below, asking what would you do with this opportunity. See original post HERE
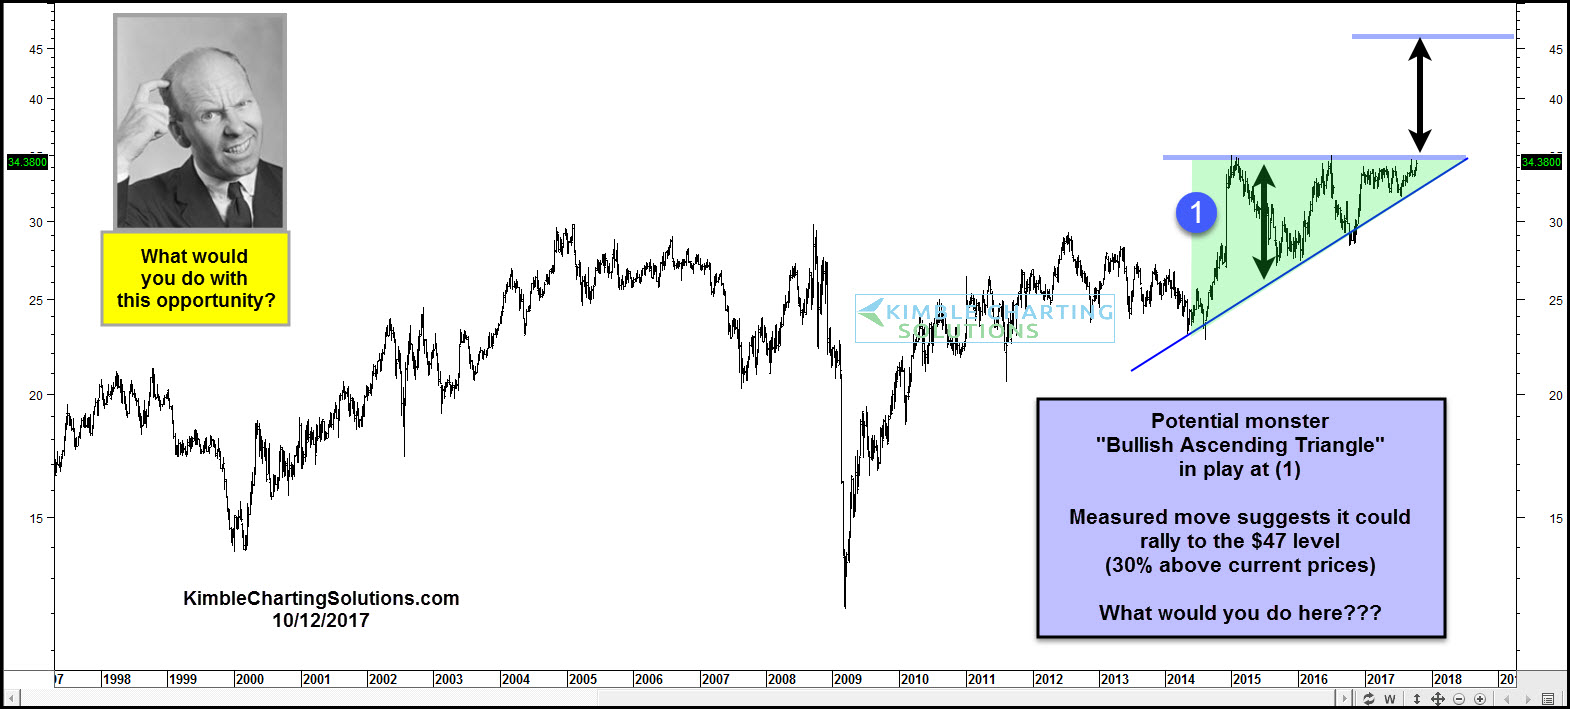
CLICK ON CHART TO ENLARGE
Premium and Sector Members bought into this pattern at the time, as the pattern two-thirds of the time, results in a beak out to the upside. Below looks at an update to this bullish ascending triangle pattern update to Hawaiian Electric (HE) .
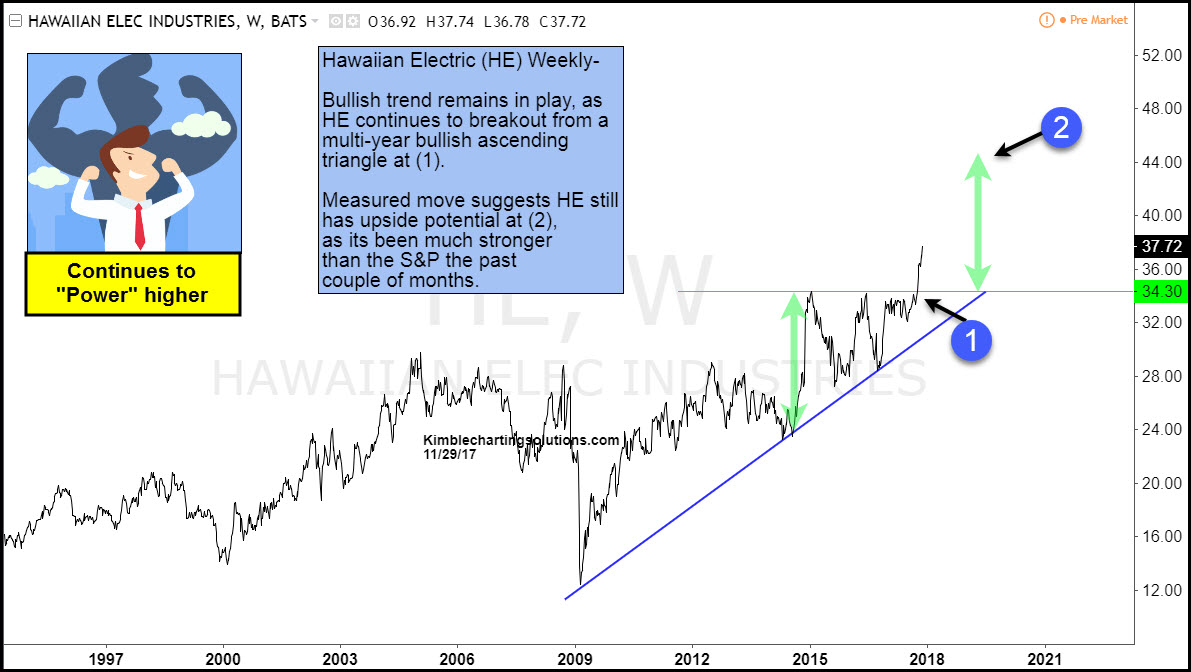
CLICK ON CHART TO ENLARGE
Since the original opportunity post on 10/12, Hawaiian Electric is up 10%, out pacing the S&P by nearly 8% in 7-weeks.
The chart above adds a measure move calculation to the pattern, reflecting that the bullish ascending triangle suggests in the long term, HE has more room to run to the upside, where it could reach the target at (2).
Members continue to bring stops up on this position as it powers higher.
