

The Nikkei 225 now finds itself at its “Half Way” point of the 20-year crash, based up 1989 highs and 2009 lows. Could it be creating a topping pattern or major reversal at a critical price point? What this important index does at a key price zone could end up impacting stocks in the states and around the world?
Below looks at the chart patterns of the Nikkei 225 over the past 30-years on a monthly basis-

CLICK ON CHART TO ENLARGE
The chart above highlights that the Nikkei 225 is at its 50% Fibonacci retracement level of its 1989 highs and 2009 lows as well as testing it’s 1997 highs at the same time at (3). While testing this key retracement level, the Nikkei could be creating a bearish reversal pattern (bearish wick pattern) at (3).
While the Nikkei is testing what could be an important price point, London & France could be testing the tops of rising channels at the same time.
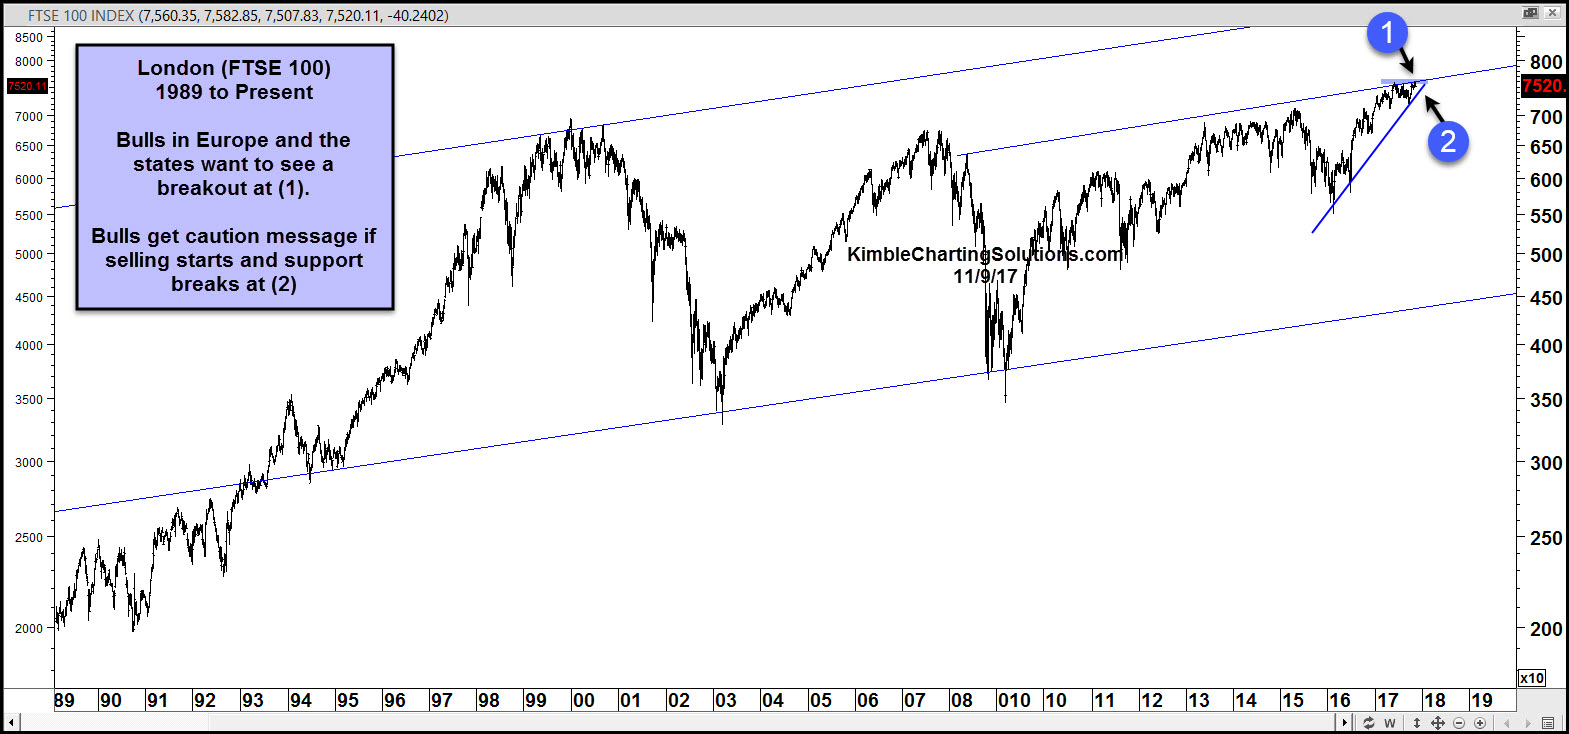
CLICK ON CHART TO ENLARGE
Last week the Power of the Pattern highlighted that London and France could be testing 800-pound resistance lines. See post HERE
The trends in the Nikkei, FTSE 100 & CAC-40 remain up, as one week’s price action does not change that trend!!!
One thing the Power of the Pattern looks for and shares with its members is price points that could lead to key inflection points. Bulls in Japan, London, France, United States and around the world DO NOT want to see reversal patterns/selling pressure start at these potential price zones. If they would, it would not prove that the trends are broken. It would send a caution message to bulls though!
