
CLICK ON CHART TO ENLARGE
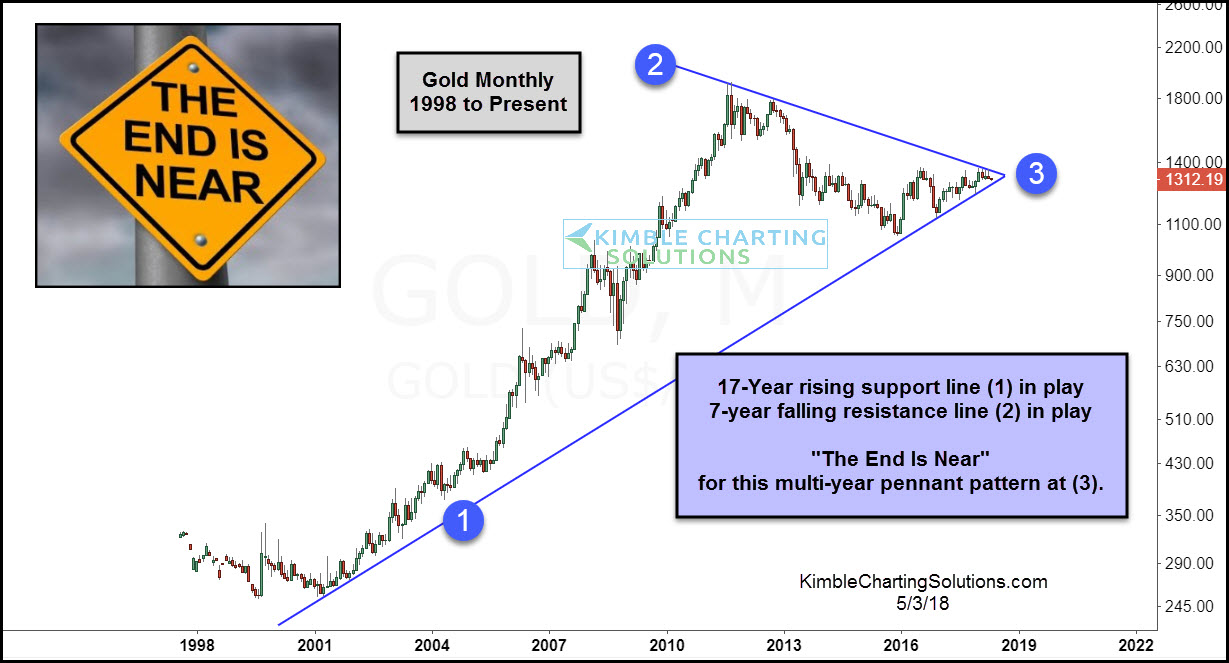
The Long-Term trend for Gold is up, as it continues to remain above 17-year support line (1).
The 7-year trend for Gold is down, as it continues to trade below falling resistance line (2).
These two long-term support/resistance lines look to be forming a multi-year pennant pattern that is “About To End.” Pennant patterns often indicate frustration for both bulls and bears as the price action is choppy, trendless and narrowing. These patterns often lead to opportunities when the pattern ends, as large moves often follow a breakout or breakdown.
Dual resistance is in play for Gold just above current prices. Should it succeed in breaking out, what could the rally look like?

CLICK ON CHART TO ENLARGE
If Gold would happen to break above heavy dual resistance, the “Measured Move” suggests it could rally to at least the $1,800 level at (1).
At the 2011 highs, the Power of the Pattern suggested that “Gold could be flat to down for years to come.” If Gold would breakout above dual resistance at the end of this pennant pattern, it would be the best price message gold has seen in years.
What Gold does at the end of this pennant pattern is important and a breakout or breakdown will create multi-year opportunities! If you would like to receive pattern analysis on Gold, Gold Miners, Silver or Copper, we would be honored if you were a Metals Members.
Click Here for sign up information and membership benefits.
–
