
The Gold rally in June was very impressive. Is the bear market in Gold over? Many are of the opinion a major breakout in Gold has taken place. What this indicator does at current levels could go a long way to seeing if the rally in June will continue into July!
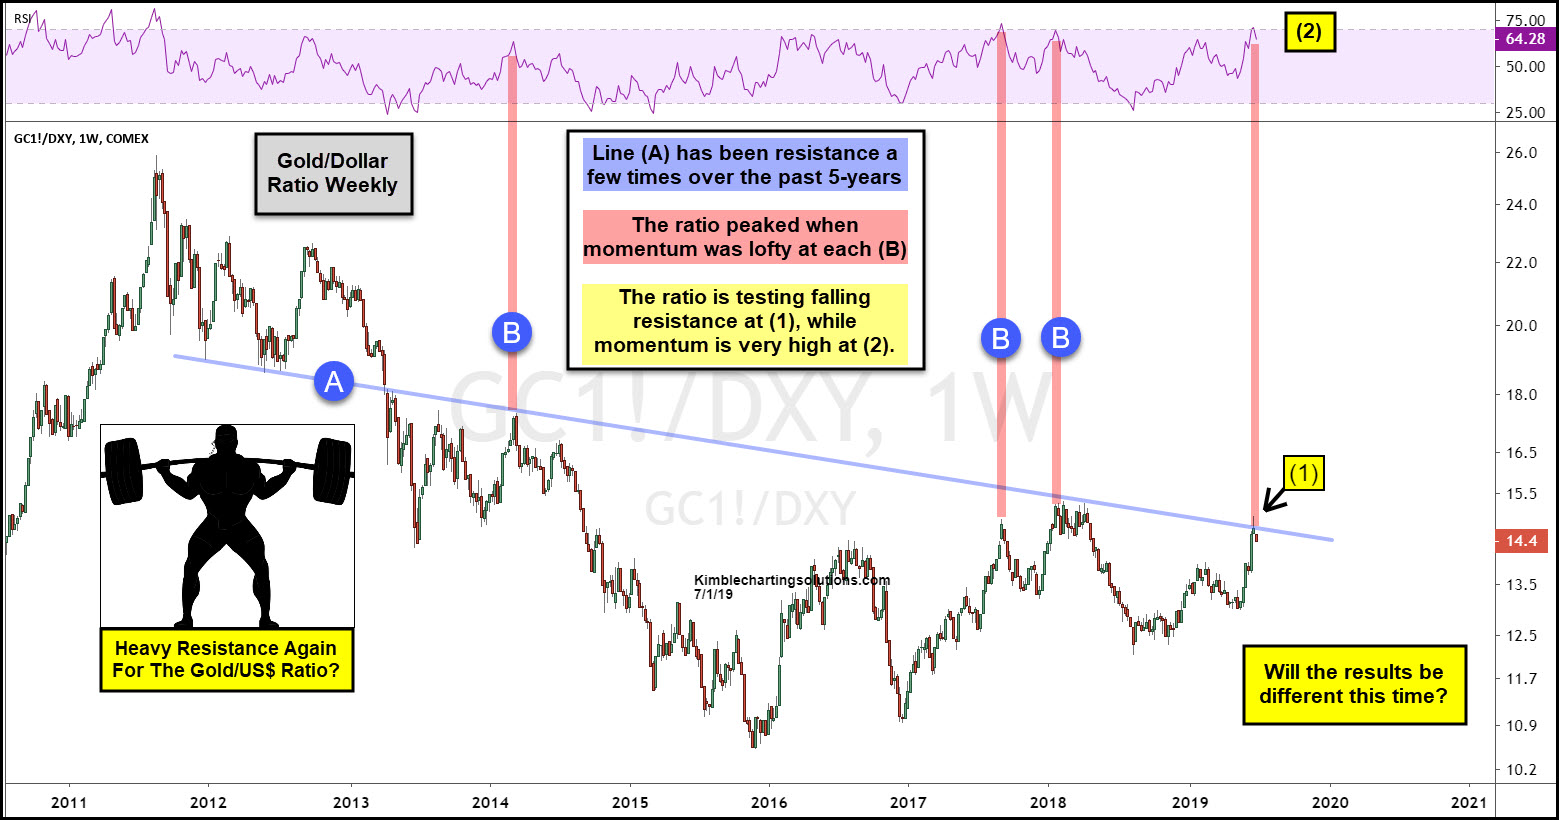
The chart looks at the Gold/US Dollar ratio on a weekly basis over the past 9-years. The ratio for the past 8-years has created a series of lower highs, something that Gold bulls would love to see change.
The ratio has created a series of lower highs below line (A) since early 2013. The ratio has attempted a few times to break above this line with no success.
A few time the ratio’s momentum indicator was lofty and the ratio peaked near each (B).
Currently, the ratio is testing falling resistance at (1) as momentum is lofty at (2). In the past Gold peaked when these conditions were present.
Will it be different this time? Gold bulls sure hope so!!!
If staying on top of conditions and opportunities in the metals market (Gold, Silver, Copper, and Miners) are of interest to you, you would benefit from being a Metals member or a Weekly Combo Member. Check out details HERE-
–
