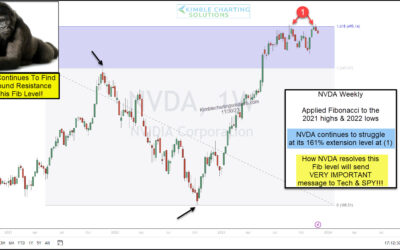
Market Leader Nvidia (NVDA) Struggling At Key Fibonacci Resistance!
Technology stocks have lead the market higher for nearly 2 decades. Semiconductors have been a big part of that leadership. And the leader of all leaders, Nvidia (NVDA), has helped the Nasdaq soar over the past year. But its leadership has come into question of late…...
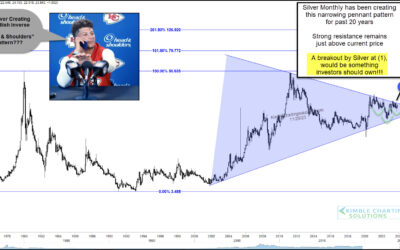
Silver Bullish Head & Shoulders Near Breakout Level!
Precious metals prices have quietly crept higher in recent weeks. And if the rally keeps going, Silver could trigger a very bullish buy signal. Today, we look at a long-term “monthly” chart of Silver. And, as you can see, Silver has formed a gigantic pennant pattern...
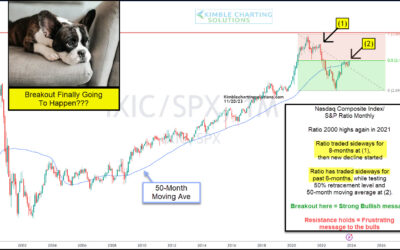
Are Technology Stocks Ready To Lead the Next Bull Market?
The main engine of the domestic economy and stock market indices is the technology sector. No doubt about it. Technology stocks have lead the stock market for over two decades, so it’s always worth watching the Nasdaq indices and how they are faring. Today we provide...
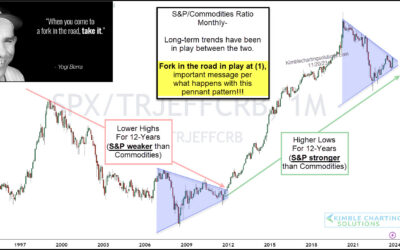
Equities / Commodities 12-Year Cycle Performance Outlook and Update
Who says cycles don’t exist? Today, we put cycles on full display in looking at the performance of two of the most important asset classes: Equities and Commodities. The chart below takes a long-term “monthly” view of the performance ratio of the S&P 500...
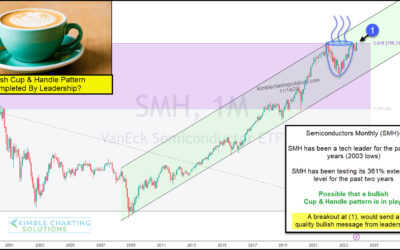
Are Semiconductors (SMH) Nearing Cup With Handle Bullish Breakout?
The Semiconductors Sector ETF (SMH) has been a market leading sector for nearly two decades. And after a brief swoon, the Semiconductors (SMH) are heating up once again. Today’s chart is a long-term “monthly” view of the SMH. As you can see, this market leading sector...
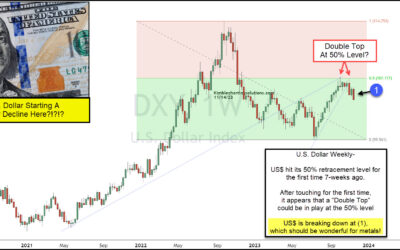
Will US Dollar Weakness Be Bullish For Gold & Silver?
A couple of weeks ago, we highlighted the U.S. Dollar as an asset ready for a big move. King Dollar was trading sideways and at important price resistance, so something had to give. Today, we revisit that “weekly” chart and provide an update on where the buck stands....
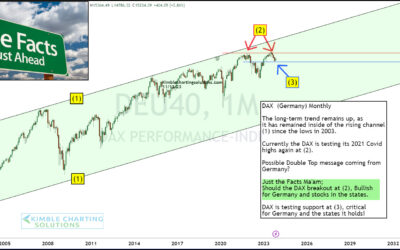
Germany (DAX Index) About To Send A Critical Message To Stocks In The States!
Germany is one of the most important stock market’s in the world. And what it does next could very well send an important message to stocks in the United States. As you can see in the today’s long-term “monthly” chart of the German DAX index, the trend remains up....
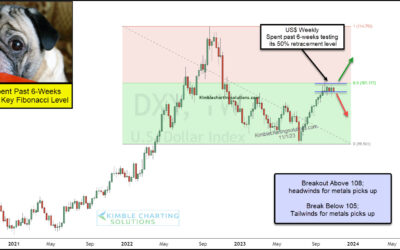
US Dollar Ready For Next Move; Commodities and Equities Watching!
The U.S. Dollar rally has taken a breather, with the King of the currency world trading sideways for the past several weeks. But there is a reason for this pause, as you can see in today’s “weekly” chart of the U.S. Dollar Index. King Dollar ran into its 50% Fibonacci...
Russell 2000 Testing Critical Price Support After Rare 100-Week Decline!
It’s been a dreadful past couple of years for the Russell 2000 and small cap stocks. Only in 2009 have small caps performed worse over a 100-week period – point (1) on today’s chart. Above we look at a long-term “weekly” chart to highlight some important technical...
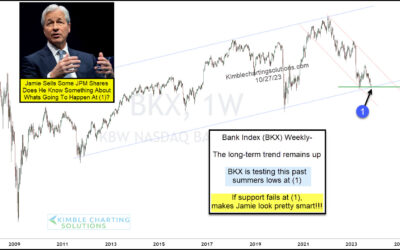
Bank Stocks Testing Critically Important Price Support!
For this first time in his tenure as JPMorgan Chase president, Jamie Dimon sold some shares on Friday. Does he know something that we should know? Are bank stocks in trouble?? Well, it’s time to look at the banks… above is a “weekly” chart of the Bank Index (BKX). As...

