
by Chris Kimble | Apr 12, 2016 | Kimble Charting
Some currencies are highly influenced by commodities or commodities are highly influenced by some currencies (great chicken or the egg debate). The Aussie Dollar is a currency that has a high correlation to the commodities space. Below looks a the Aussie Dollar over...

by Chris Kimble | Oct 6, 2014 | Kimble Charting
The U.S. Dollar just had the 6th best quarterly return in the past 34 years! (See post here) CLICK ON CHART TO ENLARGE The strong rally in the Dollar has taken it up to monthly falling channel resistance (lower right chart) with 89% of investors bullish...

by Chris Kimble | Aug 8, 2014 | Kimble Charting
CLICK ON CHART TO ENLARGE Are we hearing some Thunder from Down Under? For the first time in a couple of years the All Ordinaries Index has closed on a weekly basis below rising support at the top of its multi-year rising channel. Back in 2007, this index...
by Chris Kimble | Dec 23, 2013 | Kimble Charting, Sector / Commodity
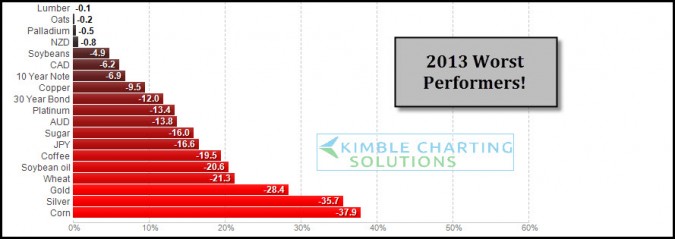
CLICK ON CHART ENLARGE 2013 has been good for stocks, the above table reflects its not been the best of years for certain assets. These are the worst performers so far YTD. As 2013 is nearing a close I wanted to share these worst performers and apply some Power of the...

by Chris Kimble | May 17, 2013 | Kimble Charting
CLICK ON CHART TO ENLARGE The Yen, Australian $ and the Euro have created pennant patterns over the past few years and each of these currencies is now breaking support of the pennant patterns. As the same time the US$ has been unable to “Close on a...

by Chris Kimble | Mar 8, 2013 | Kimble Charting
The US Dollar hasn’t done this in 10-years, as it breaks from 10-year falling channel (see post here) and stocks keep moving higher. What is up with that? I feel like phoning my friend Ben and asking… “What he heck is going on here???” ...

by Chris Kimble | Feb 27, 2013 | Kimble Charting
CLICK ON CHART TO ENLARGE From a portfolio construction standpoint, when the yield on the 10-year note and Australian Dollar decline in price, history has suggested to underweight allocations towards risk assets. Check out the price situation for both of these...

by Chris Kimble | May 9, 2012 | Kimble Charting
On March 29th the Power of the Pattern shared that an indicator was suggesting the S&P 500 would fall at least 7% in value (see post here) This indicator is the Australian Dollar/U.S. Dollar ratio….when it breaks support, the 500 index often...
