by Chris Kimble | Dec 21, 2021 | Kimble Charting
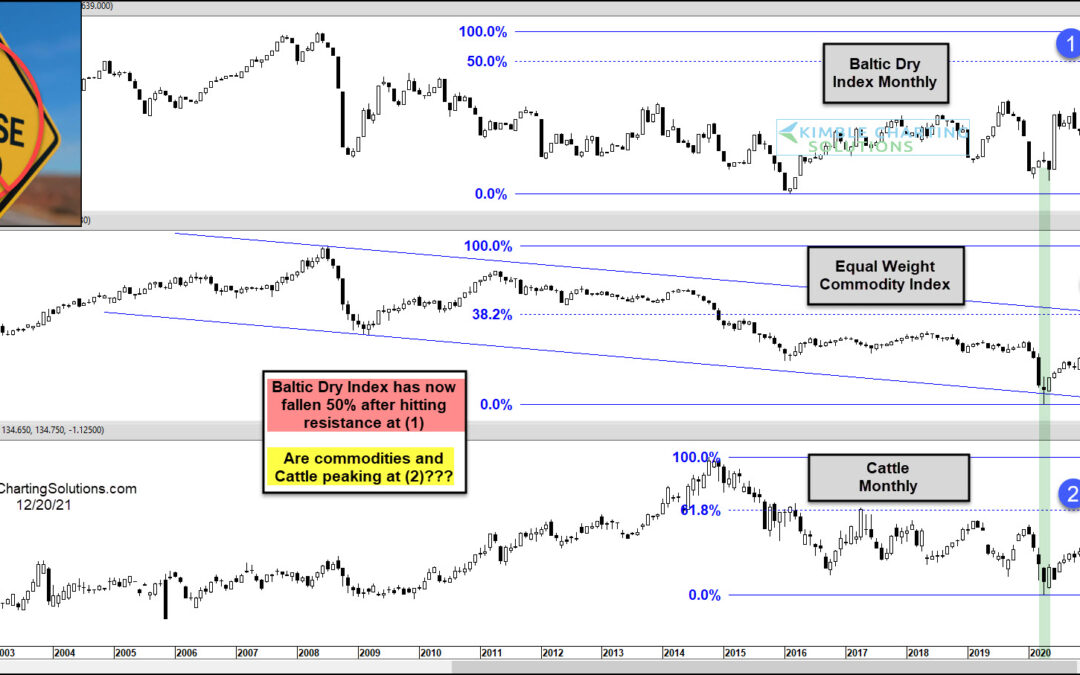
Over the past 18 months, I’ve penned several articles about traceable commodity breakouts and rising commodities prices… and inflation risks. With each breakout came more inflation pressures. And today, we continue to battle high energy, food, and housing prices. But...
by Chris Kimble | May 4, 2021 | Kimble Charting
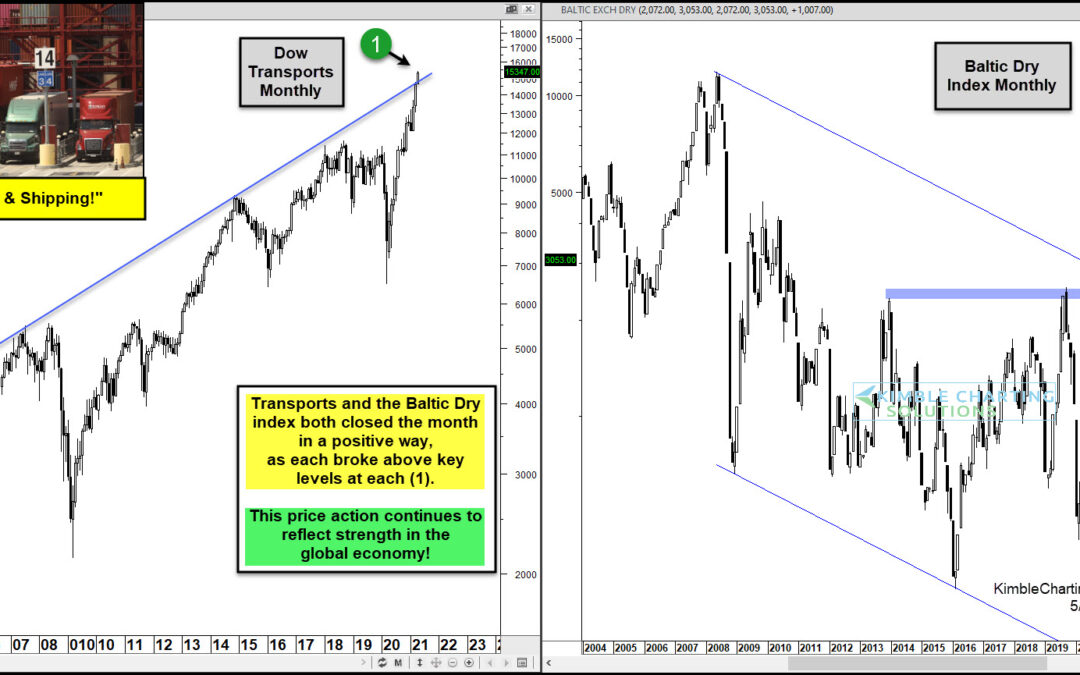
Transportation-related stocks tend to be economically sensitive. So it was no surprise to see them fall sharply last March as the COVID-19 coronavirus gripped our news and nation. But since bottoming last year, the Dow Jones Transportation Average and Baltic Dry...
by Chris Kimble | Apr 5, 2021 | Kimble Charting
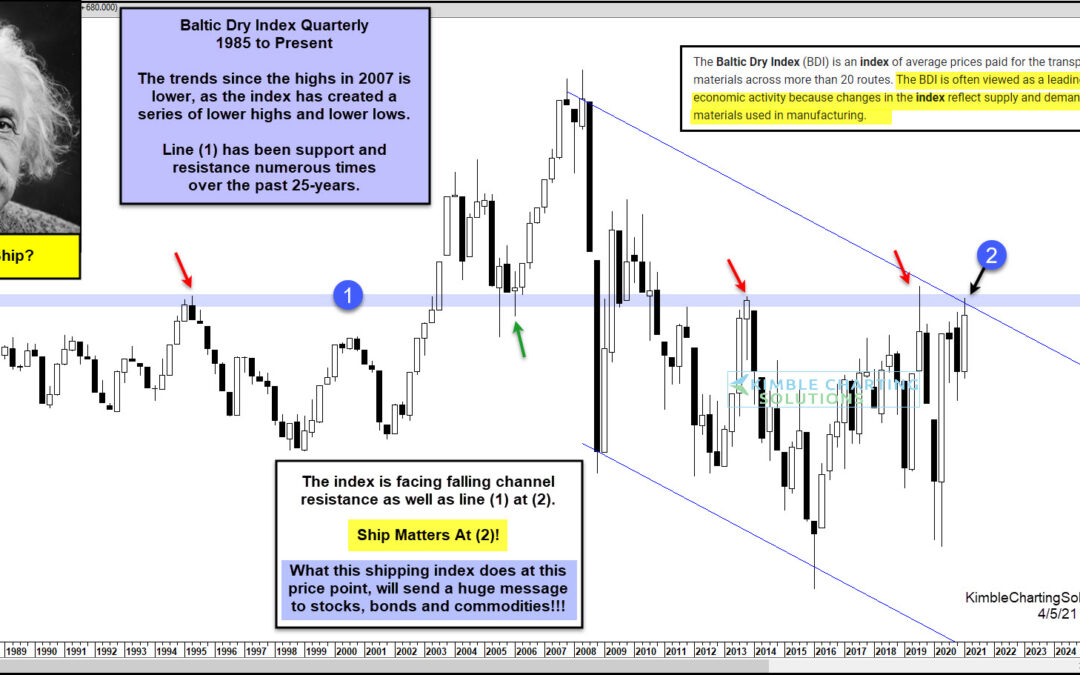
The health of the global economy relies on several key factors, but one of the more important ones is shipping. And the Baltic Dry Index (BDI) is a solid barometer for economic activity. BDI is an index of average prices paid for the transport of dry bulk materials...

by Chris Kimble | Dec 30, 2013 | Kimble Charting
CLICK ON CHART TO ENLARGE The S&P 500 has had a good year, up almost 30%. The yield on the 10-year note is up over twice that much, up 70% YTD. Can you name the index that is up almost 200% more YTD than the S&P 500? The answer is…The Baltic Dry index,...

by Chris Kimble | Jan 29, 2012 | Kimble Charting
CLICK ON CHART TO ENLARGE No doubt the Baltic Dry index has had a rough start to 2012, losing over half its value in just the first month of this year. Is the Baltic Dry index a leading or lagging indicator for the future direction of the S&P 500? The Baltic...
by Chris Kimble | Jan 22, 2011 | Kimble Charting
CLICK ON CHART TO ENLARGE Time will tell what the true scoop is with the price action of late in the Baltic Index
