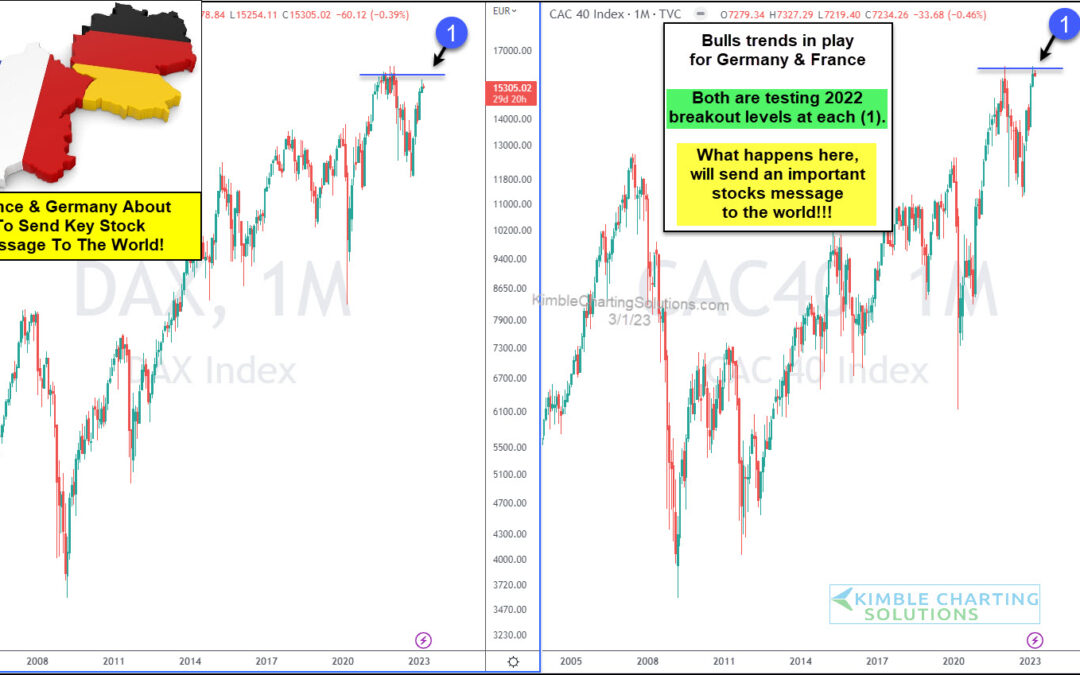
by Chris Kimble | Mar 2, 2023 | Kimble Charting
As we look across the major global stock market indices, we are seeing some divergences appear. And today we highlight one that appears to carry some importance. While the U.S. stock market indices are far from the 2022 highs, the same cannot be said for the German...
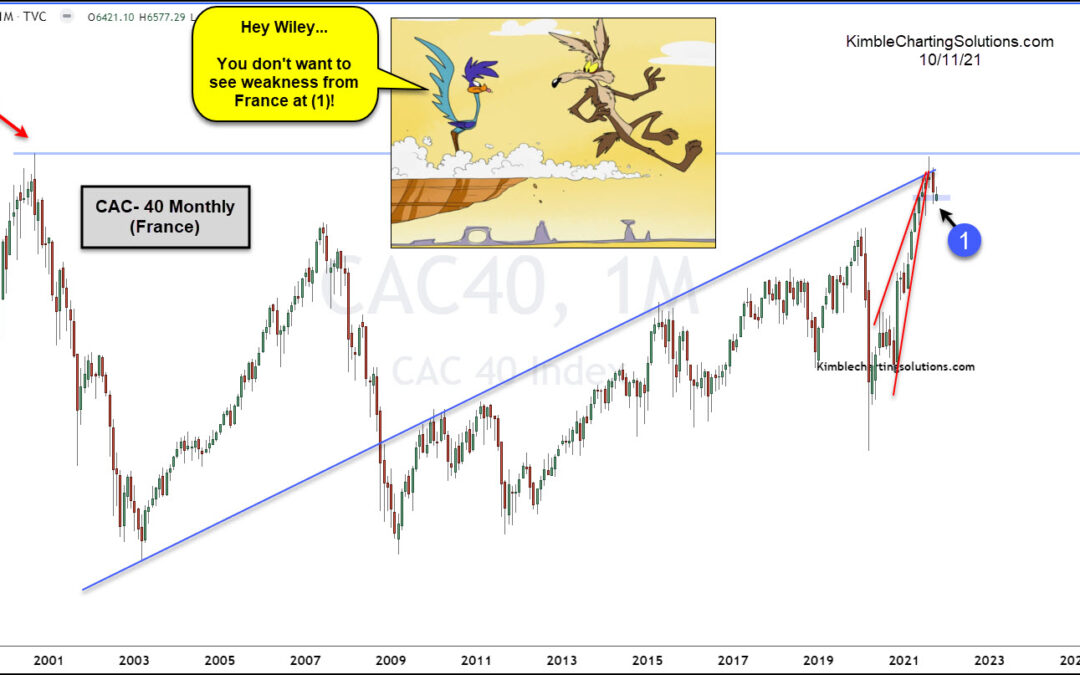
by Chris Kimble | Oct 11, 2021 | Kimble Charting
The French stock market has been very strong this year, with the CAC 40 Index streaking higher into late summer. But the rally fizzled out at a key spot, leaving the index vulnerable to a correction. Today’s “monthly” chart of the CAC 40 Index highlights this. As you...
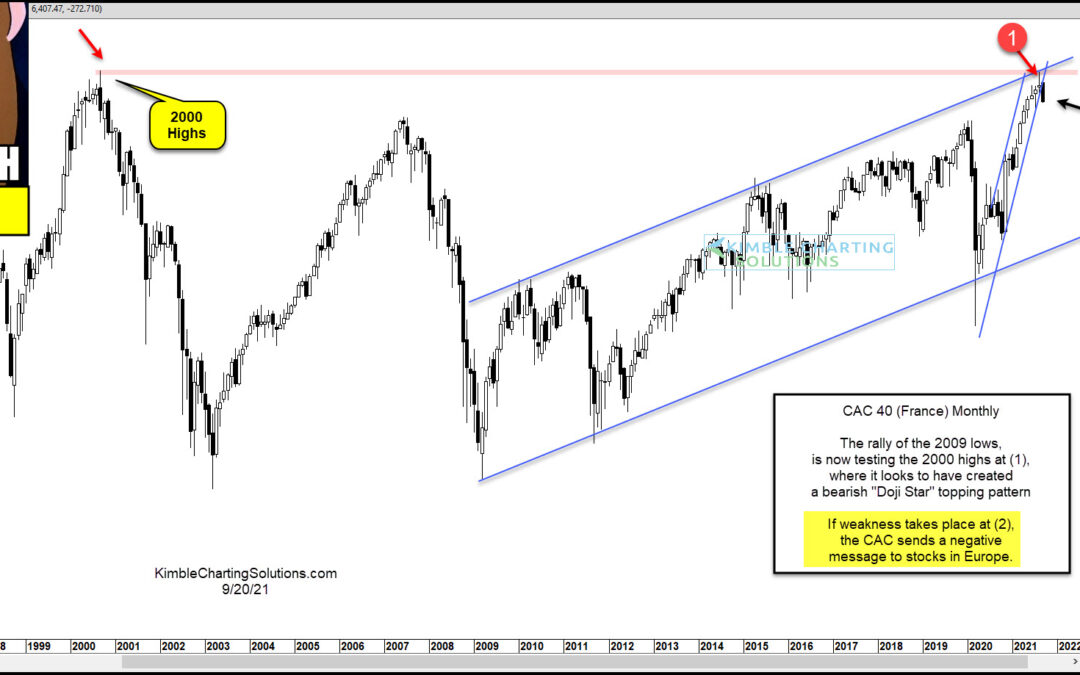
by Chris Kimble | Sep 21, 2021 | Kimble Charting
The European equity markets have rebounded from the last year’s coronavirus crash lows with similar zeal to that of the United States. Several major equity indices have made new highs and the “monthly” charts show rapid (and steep) ascents. And France’s CAC 40 stock...
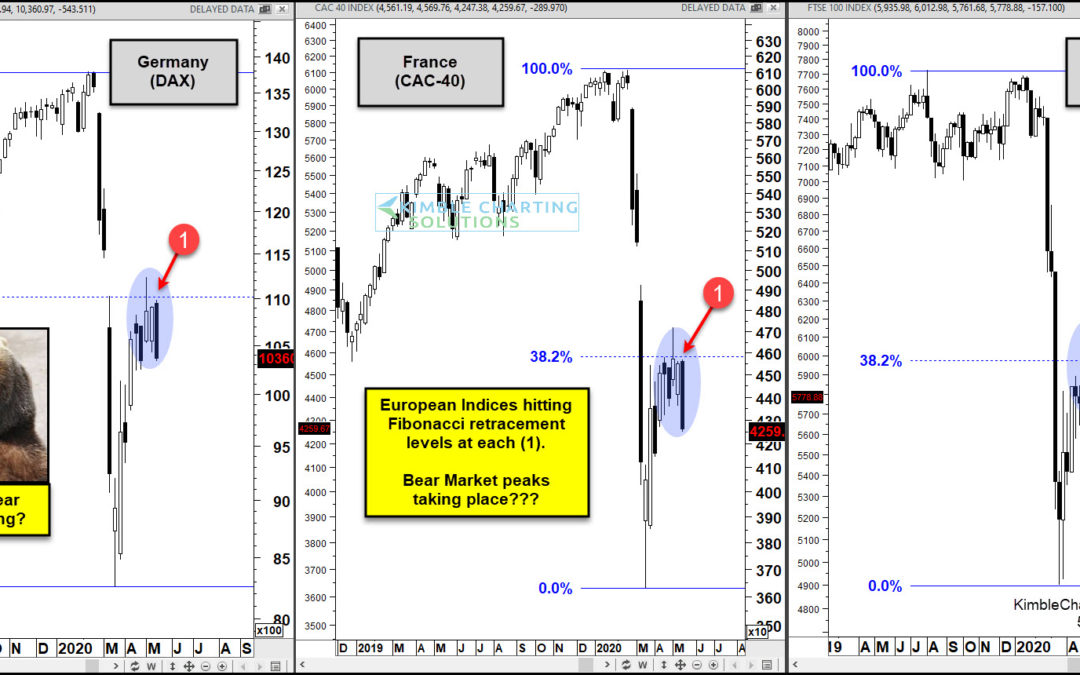
by Chris Kimble | May 14, 2020 | Kimble Charting
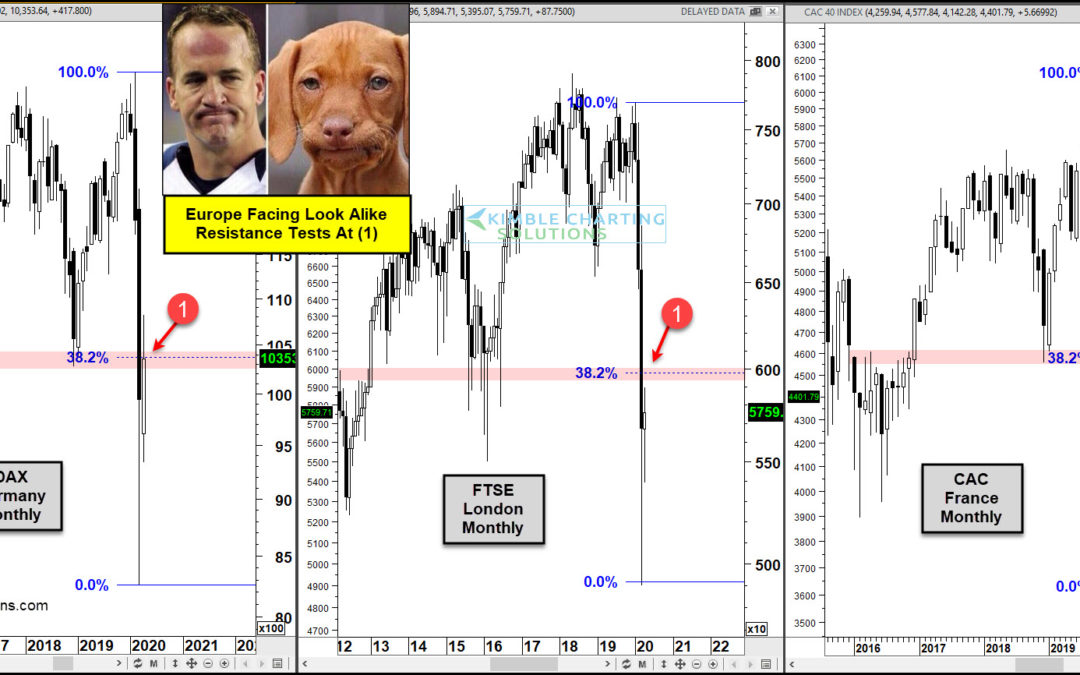
Are bear market rallies peaking in Europe? Very possible! This 3-pack looks at stock indices from Germany (DAX), France (CAC-40), and London (FTSE-100). Each index declined more than 20% from highs earlier this year, reflecting that each entered into bear markets....
by Chris Kimble | Apr 27, 2020 | Kimble Charting
Major European Stock Indices have created “Look Alike” patterns of late. Could they be sending an important message to stocks around the world? Sure could be! The DAX( Germany), FTSE 100 (London), and the CAC 40(France) have reflected relative weakness...
by Chris Kimble | Apr 15, 2020 | Kimble Charting
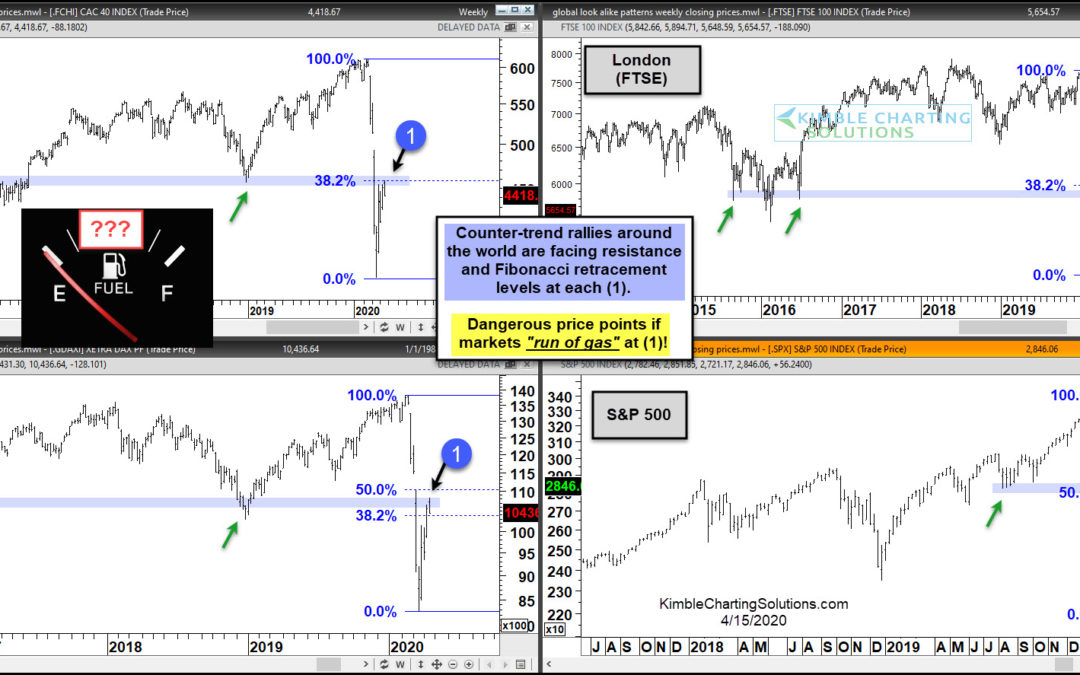
What goes up in a down market? Correlation! This 4-pack looks at patterns of Germany, London, France, and the States. No doubt each has been hit hard in the first quarter of 2020. All four have experienced counter-trend rallies, where each is facing multi-year...
by Chris Kimble | Oct 18, 2018 | Kimble Charting
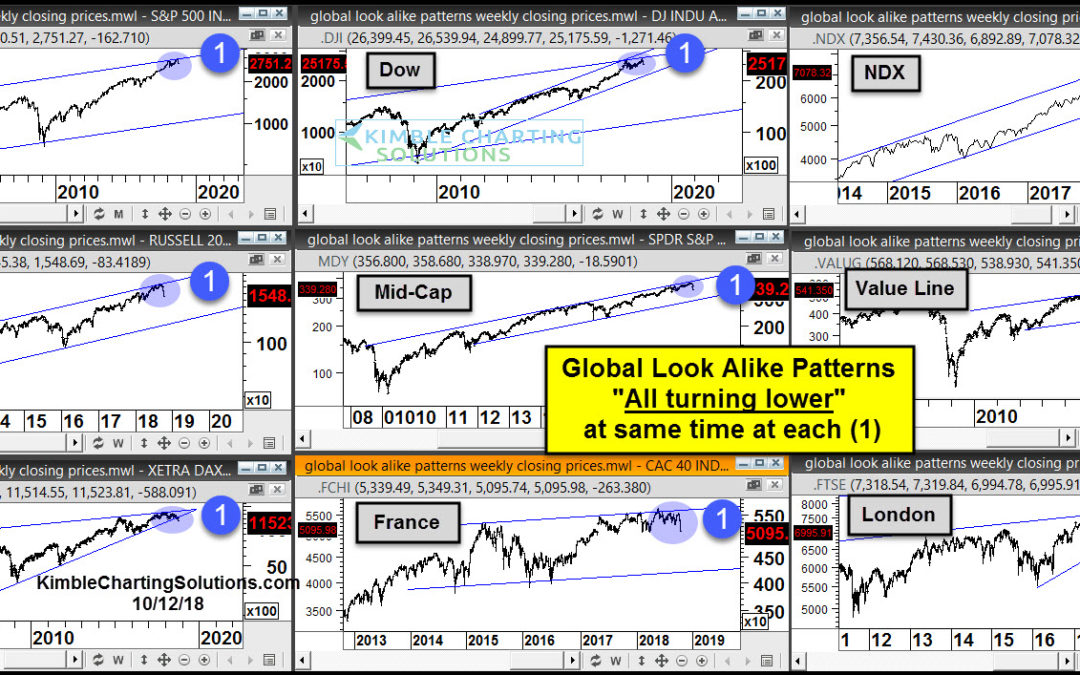
Over the past several weeks, I’ve shared several examples of key stock market indexes and indicators hitting long-term resistance. Today, we’ll do the same… but with a much wider lens. We’ll look at 9 different stock market indexes in the developed markets that look...
by Chris Kimble | Apr 25, 2018 | Kimble Charting
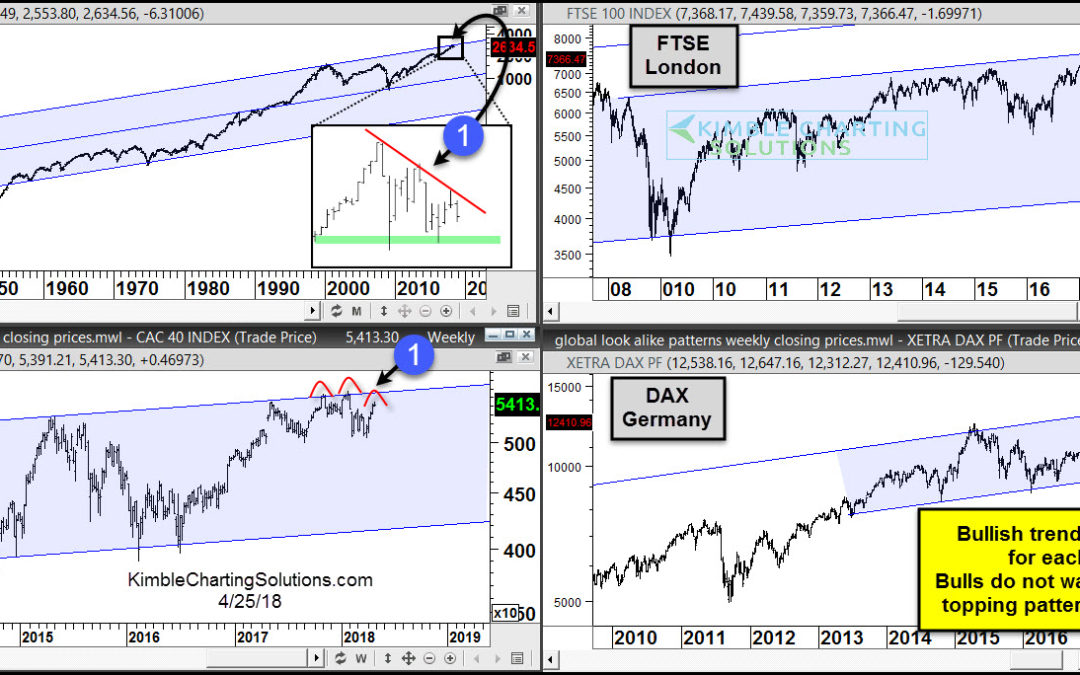
CLICK ON CHART TO ENLARGE This 4-pack reflects that each of these indices remains in uptrends and each is at the top of multi-year rising channels. Softness over the past 90-days has not changed the long-term trends. It also reflects that each could be creating some...
