by Chris Kimble | Sep 12, 2023 | Kimble Charting
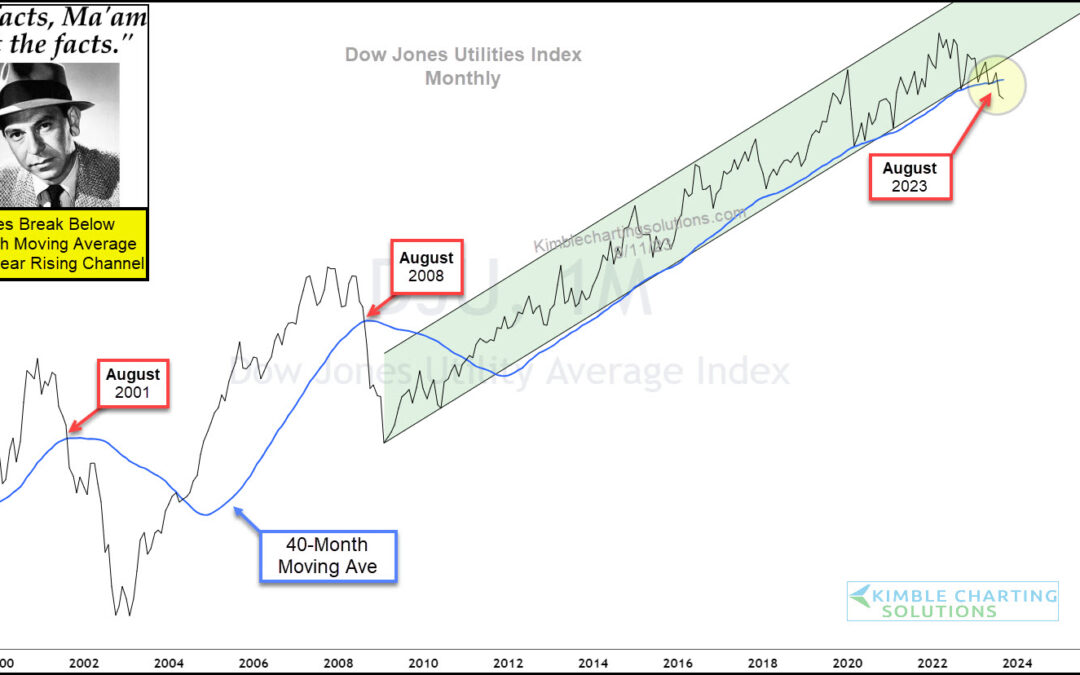
It’s been a rough go around for stocks and investors. But will it get worse before it gets better? Let’s turn to Joe Friday for “The facts, Ma’am. Just the facts.” Today’s chart features a “monthly” view of the Dow Jones Utilities Index. And, as you can see, the chart...
by Chris Kimble | Mar 5, 2019 | Kimble Charting
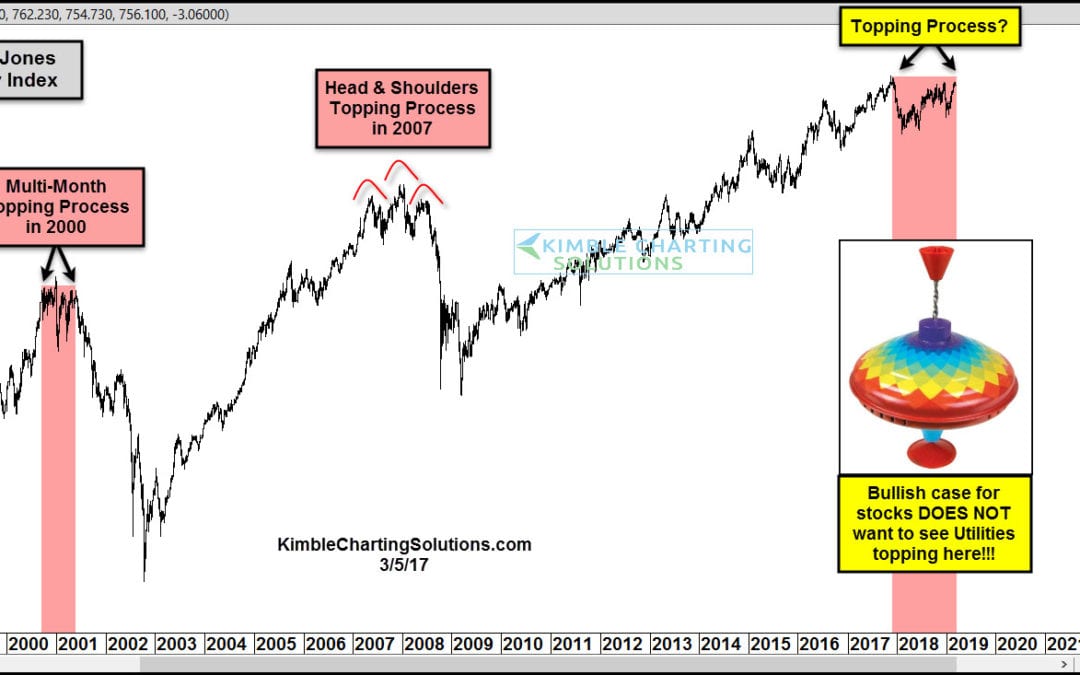
In 2000 the Dow Jones Utility index spent around 7-months creating a topping process. The S&P 500 had declined for nearly 12-months before the waterfall decline in Utilities got started. In 2007, Utilities spent nearly 12-months creating a topping process. The...
