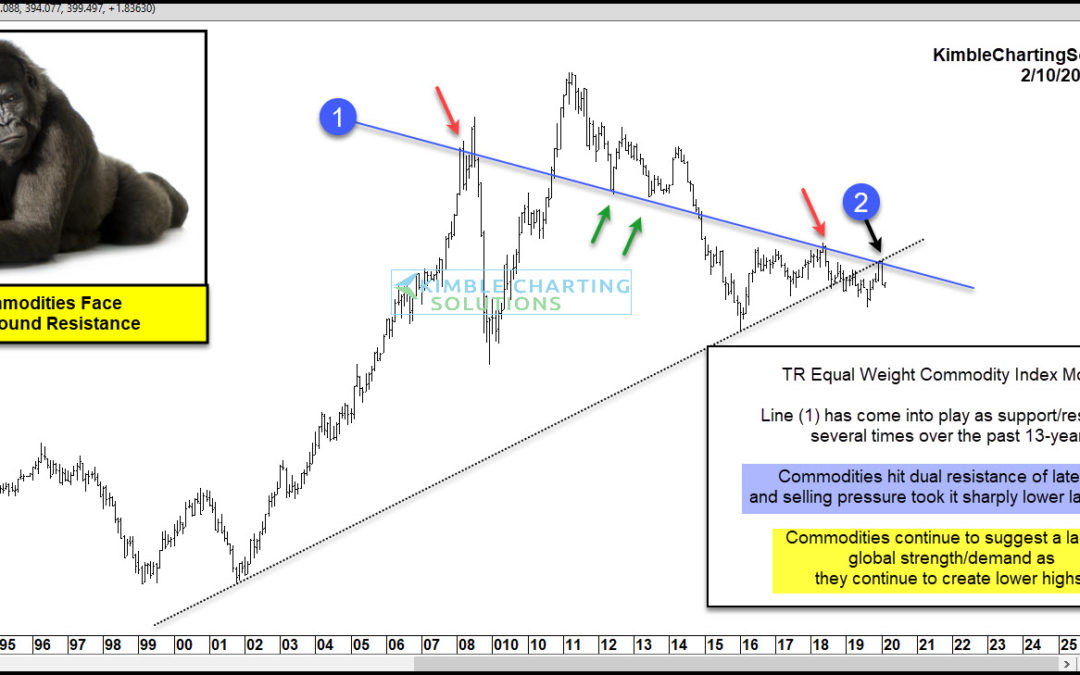
by Chris Kimble | Feb 10, 2020 | Kimble Charting
Are commodities suggesting a lack of demand is in play on a global basis? Possible! Could this impact stocks? So far it has not! The chart looks at the Thompson/Reuters Commodities Index over the past 30-years. This index has created a series of lower highs since it...
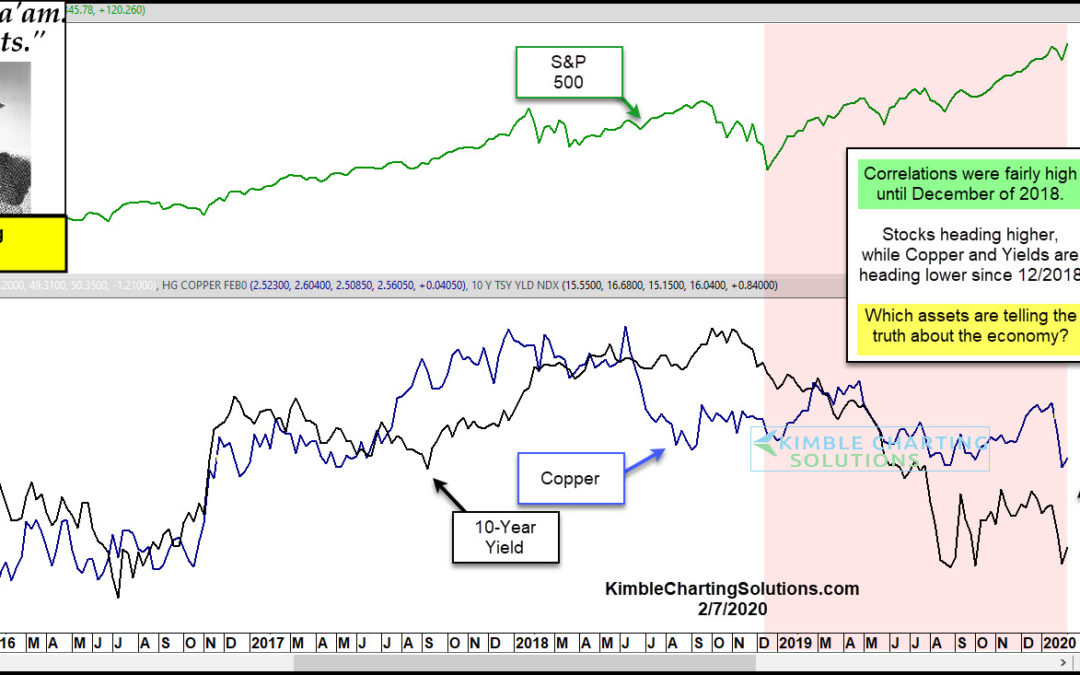
by Chris Kimble | Feb 7, 2020 | Kimble Charting
Historically Stocks, Yields and Doc Copper often trend in the same direction. Unless its different this time, one asset(s) is way out of whack! This chart looks at the S&P 500, Doc Copper and the Yield on the 10-year note over the past 5-years. From late 2015...
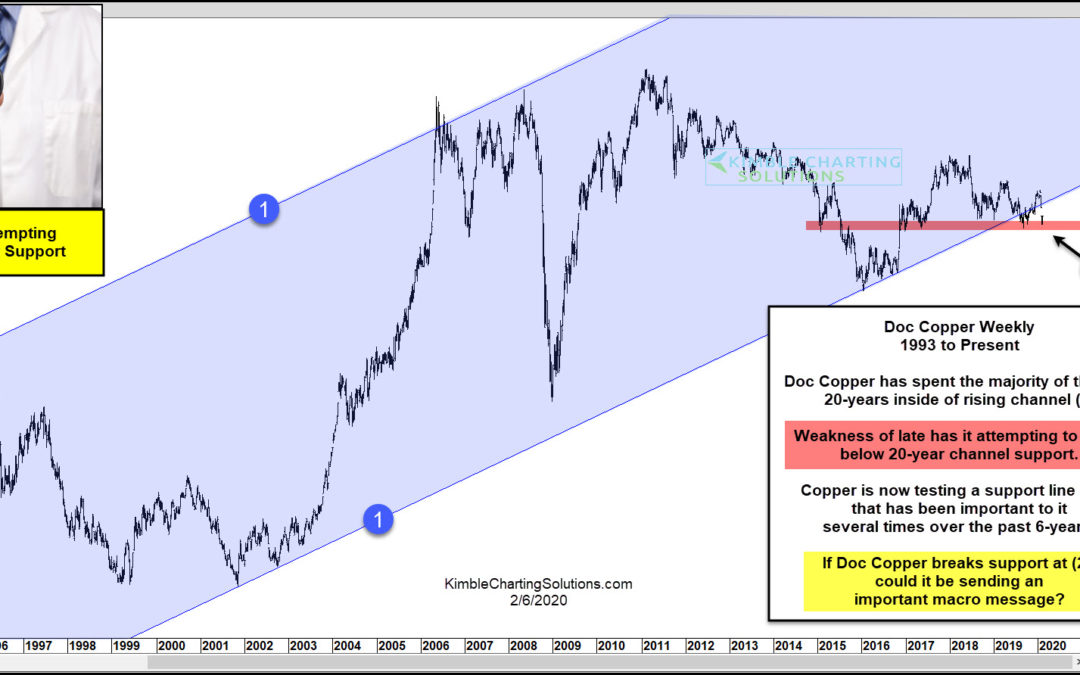
by Chris Kimble | Feb 6, 2020 | Kimble Charting
If the saying “So Goes Doc Copper, So Goes The Global Economy” is true, what Ole Doc Copper does from current levels will send an important message to global markets! Doc Copper has spent the majority of the past two decades inside of bullish rising...
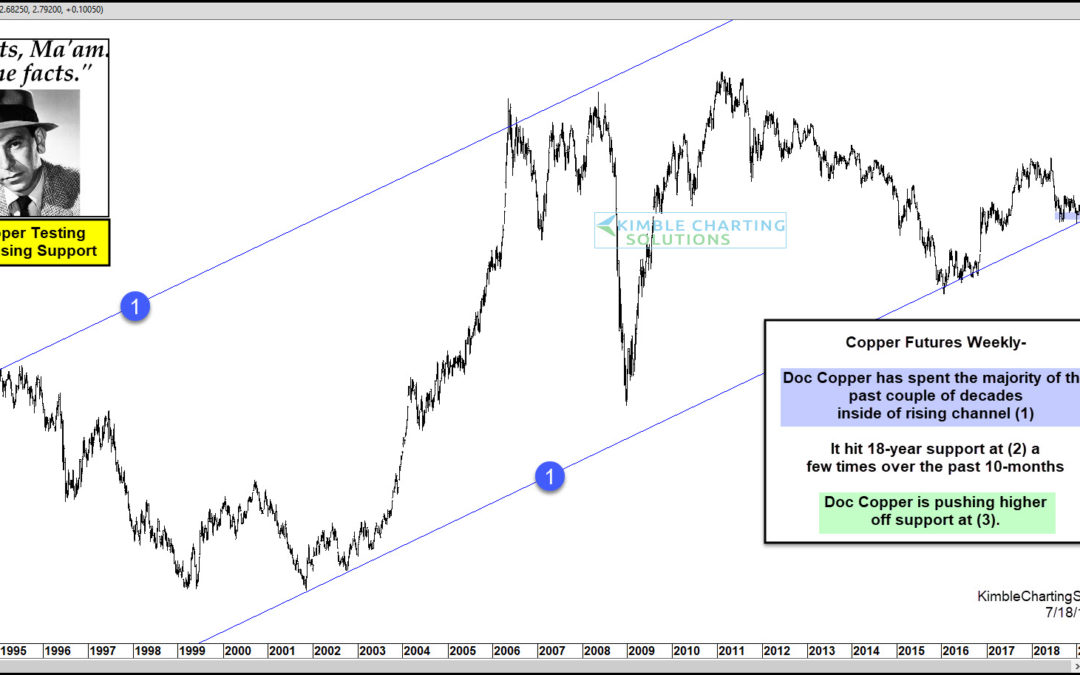
by Chris Kimble | Jul 19, 2019 | Kimble Charting
Gold & Silver have been hot of late! Is Doc Copper about to do the same? Possible says Joe Friday. This chart looks at Copper Futures over the past 27-years. Copper has spent the majority of that time inside of rising channel (1). The decline over the past year...
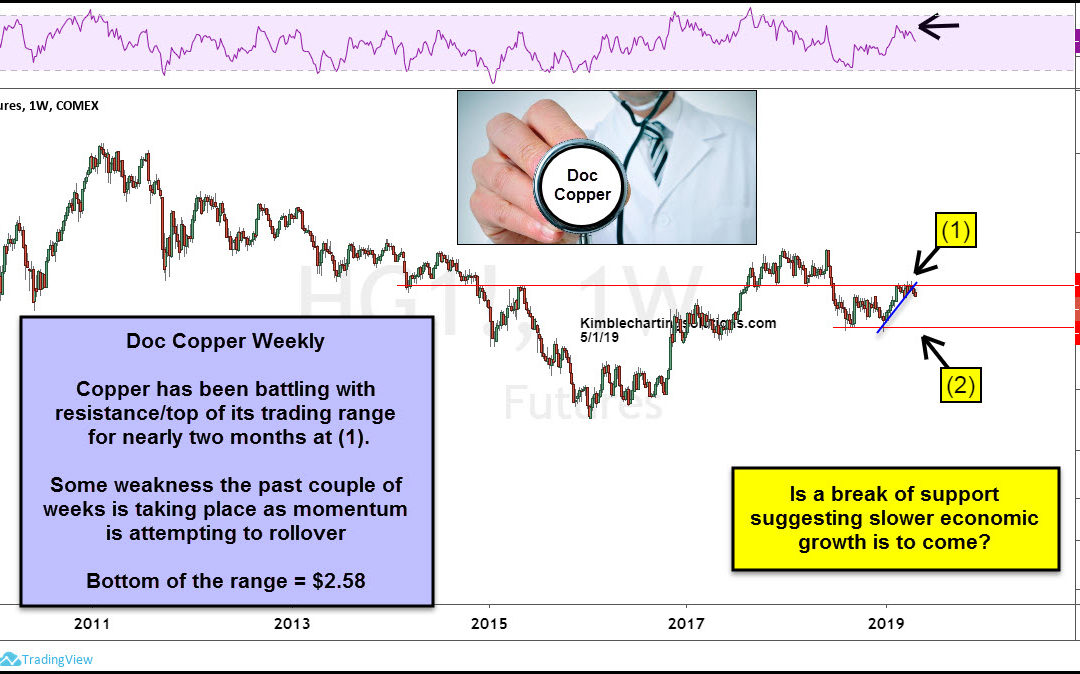
by Chris Kimble | May 1, 2019 | Kimble Charting
Is Doc Copper of late suggesting the economy is about to slow down? Possible! Copper futures have remained in a trading range since last summer, with resistance around $2.95 and support near $2.60. Over the past couple of months, Doc Copper has traded sideways near...
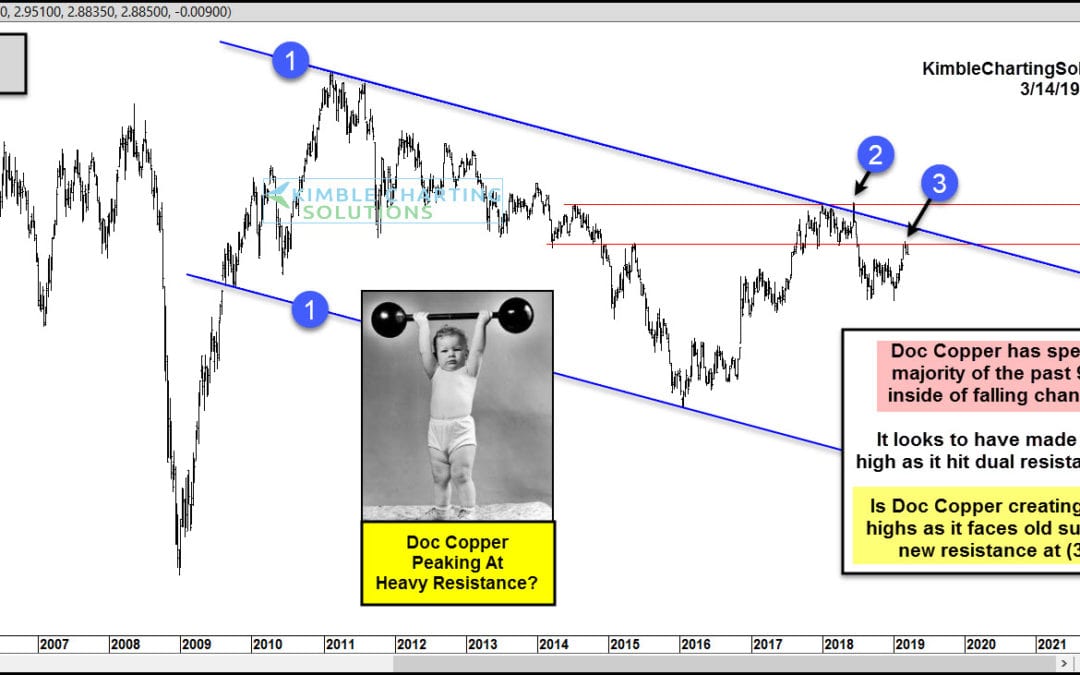
by Chris Kimble | Mar 14, 2019 | Kimble Charting
Is Doc Copper suggesting that economic weakness is around the corner? Possible Doc Copper has created a series of lower highs and lower lows over the past 9-years inside of falling channel (1). Last year Copper looks to have double topped at 2014 highs and the top of...
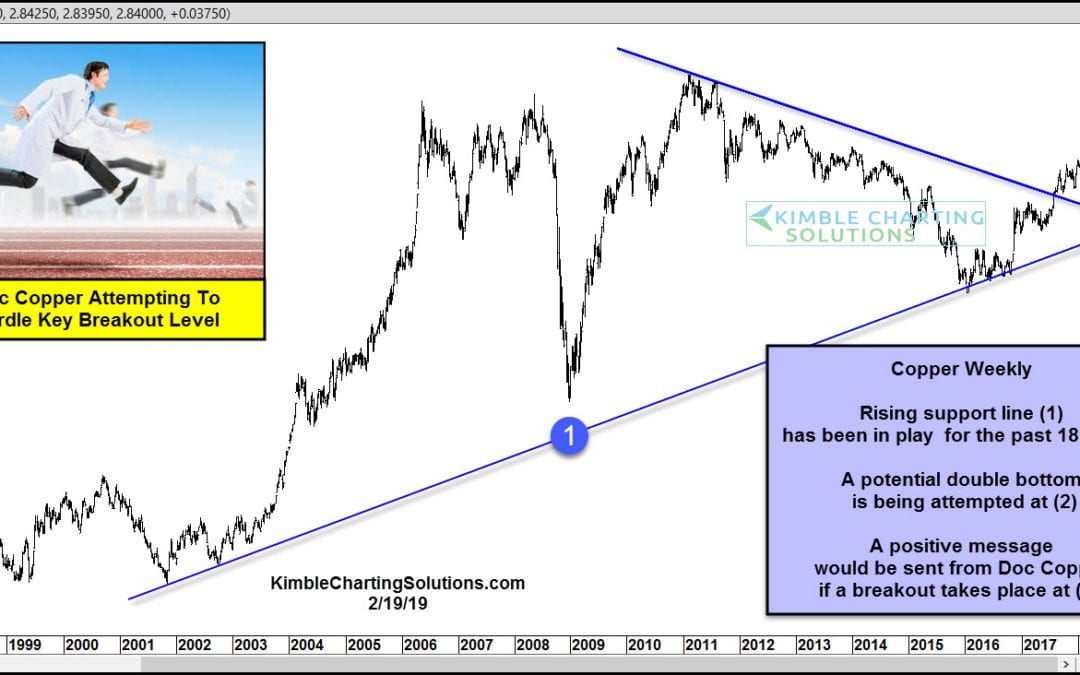
by Chris Kimble | Feb 19, 2019 | Kimble Charting
Doc Copper often times sends important messages, to the global economy, reflecting growth or lack thereof. An important price test is currently in play for Ole Doc Copper! The long-term trend for Copper remains up, as it has created a series of higher lows for the...

by Chris Kimble | Sep 21, 2018 | Kimble Charting
CLICK ON CHART TO ENLARGE Doc Copper over the past few months has been hit hard, as sellers drove it down nearly 25%. This decline brought it to the price point (2), where four different support lines came into play, which looks like a support cluster. As the decline...
