by Chris Kimble | Jan 7, 2020 | Kimble Charting
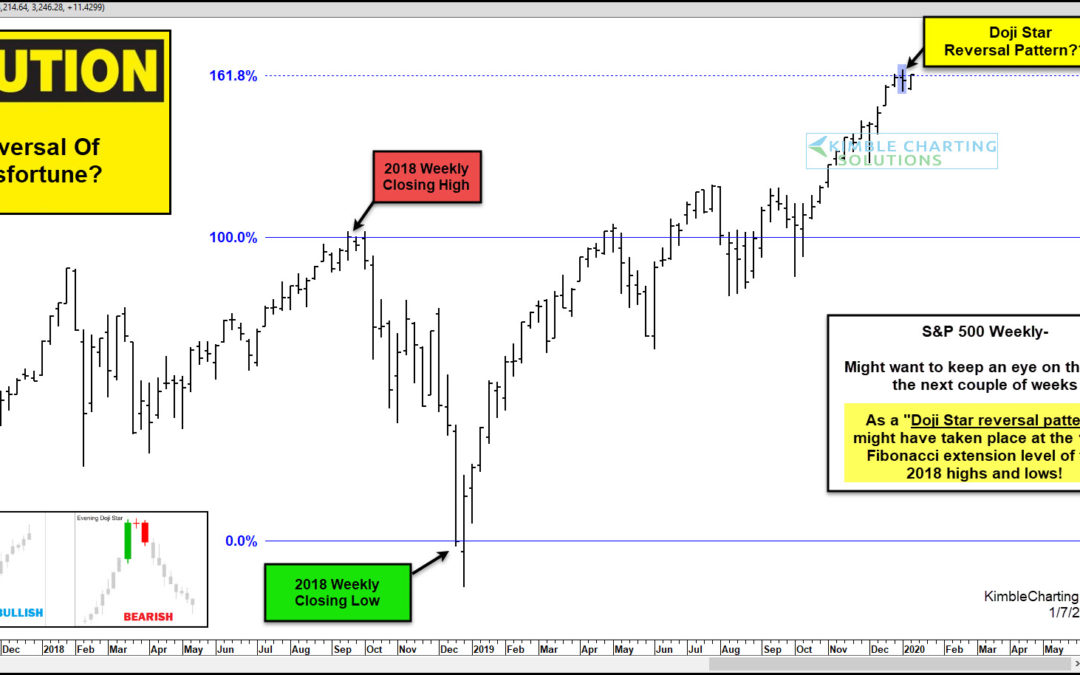
Is a bearish reversal pattern in S&P 500 taking place at a key Fibonacci level? Possible! This chart looks at the S&P 500 on a weekly basis over the past few years, where Fibonacci was applied to the “weekly closing highs and lows” during 2018. The...
by Chris Kimble | Oct 13, 2014 | Kimble Charting
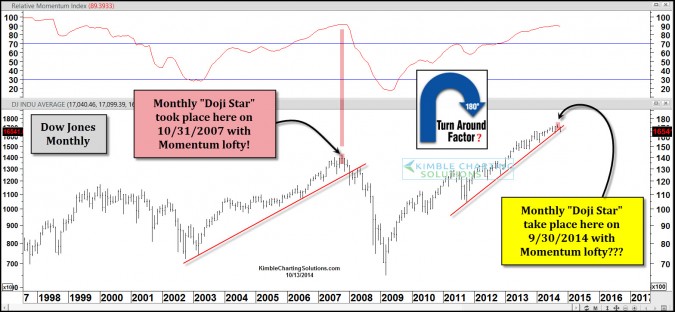
CLICK ON CHART TO ENLARGE Did the Dow Jones Industrial index create a “Doji Star” topping pattern last month? Possible! Doji Star patterns (which look like a + sign on a chart) can take place at key reversal points/highs & lows. The above chart...
