877-721-7217 services@kimblechartingsolutions.com
  • Twitter
  • Twitter
  • Contact
  • Cart
0 Items
Kimble Charting Solutions
  • Blog Sign Up
  • Free Research (Blog)
  • Research Subscriptions
    • Most Popular Research
    • Premium Member Research
    • Weekly Research Reports
  • What We Do
    • What We Do For You
    • Charts Solve These Investing Challenges
    • What You Receive
  • About Us
    • About Us
    • Testimonials
    • Videos
    • As Seen On
  • Login
Select Page
Crude Oil About To Drop 50% And Take Stocks With It? (Updated)

Crude Oil About To Drop 50% And Take Stocks With It? (Updated)

by Chris Kimble | Feb 28, 2020 | Kimble Charting

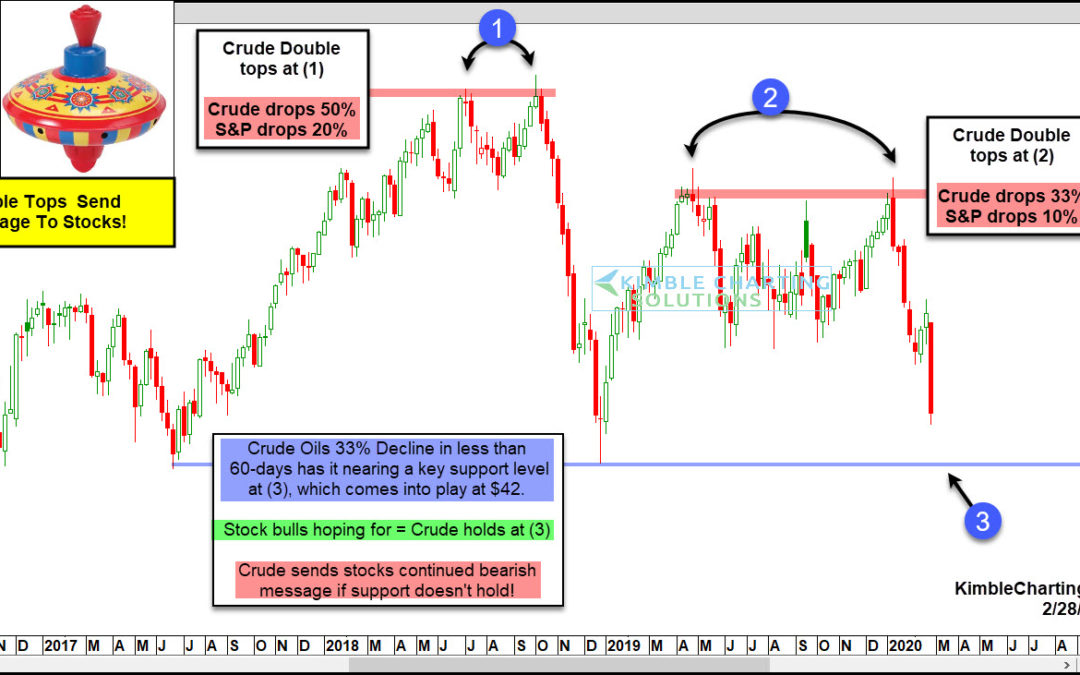
Crude Oil created its second top back in October of 2018 at (1) and then it proceeded to decline nearly 50%! What did the S&P do while Crude declined 50%, it fell nearly 20% in less than 90-days! The above chart was shared on 1//8/2000, suggesting that Crude Oil...

Topic Areas

10-year yield Apple Banks bonds China Commodities Copper CRB Index Crude Oil DAX Dollar Update Dow Jones Emerging Markets Euro GDX gdxj gld gold Gold Bugs Gold Stocks Govt. bonds High Yields Interest Rates Joe Friday Junk Bonds Kimble Charting Mid-Caps NASDAQ 100 ndx 100 Nikkei 225 NYSE Composite real estate Russell 2000 S&P S&P 500 Shanghai index silver slv SPX spy TLT US dollar What would you do? Wilshire 5000 Yields
  • Terms of Use
  • Contact
  • Twitter

Copyright ©2021 Kimble Charting Solutions. All Rights Reserved | Design by 16Wells