
by Chris Kimble | Aug 7, 2014 | Kimble Charting
CLICK ON CHART TO ENLARGE Market Cap to GDP is a long-term valuation indicator that has become popular in recent years, thanks to Warren Buffett. The above chart was created by Doug Short, highlighting the current level of the Buffett indicator. As you can see its now...
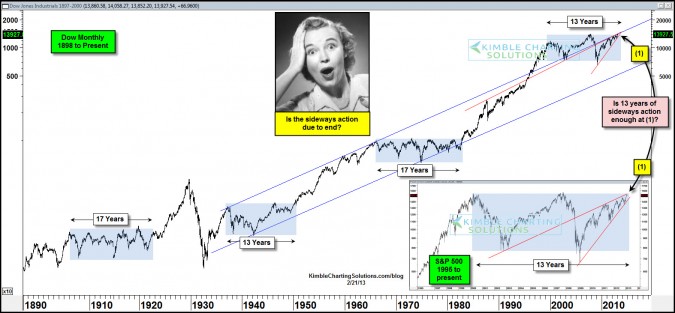
by Chris Kimble | Feb 21, 2013 | Kimble Charting
CLICK ON CHART TO ENLARGE The chart above reflects that since the late 1800’s, the Dow has experienced three periods where it traded sideways, ranging from 13 to 17 years. The S&P 500 finds itself within a few percentage points of where it was 13 years ago....

by Chris Kimble | Aug 19, 2010 | Kimble Charting
Today Doug Short was kind enough to share with his viewers my new blog….WELCOME! Doug referenced the first chart I sent to him…it is amazing what can happen in six months and how time flies! The first chart Doug posted was a chart of yields...
