by Chris Kimble | Feb 9, 2011 | Kimble Charting
In the chart below, I highlighted that the Dow was breaking above key resistance line (1) for only the 2nd time in its history at (3). (see post here) CLICK ON CHART TO ENLARGE Game plan at that time was to BUY THE DOW, due to the...

by Chris Kimble | Jan 21, 2011 | Kimble Charting
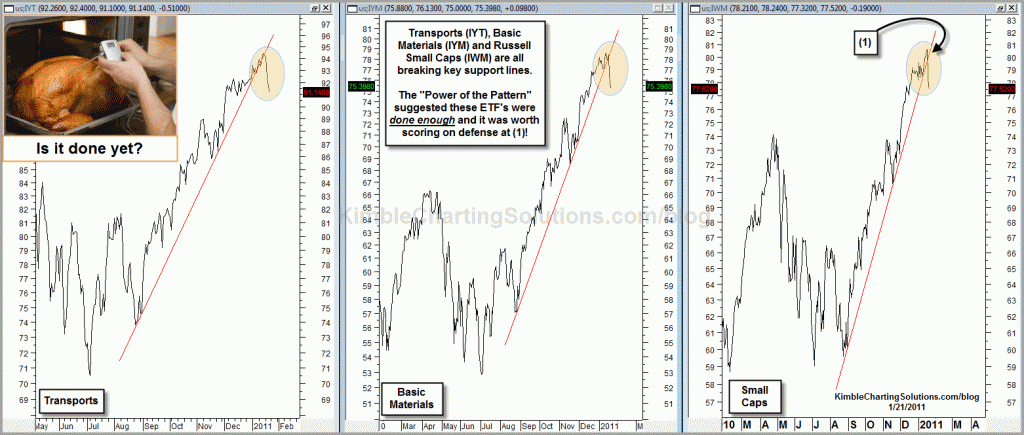
CLICK ON CHART TO ENLARGE Steep support lines have been broken in these key sectors. The support lines deserve some attention since they started back in September, when the number of bulls was the lowest since the March of 2009 lows. Check out the lower...

by Chris Kimble | Jan 21, 2011 | Kimble Charting
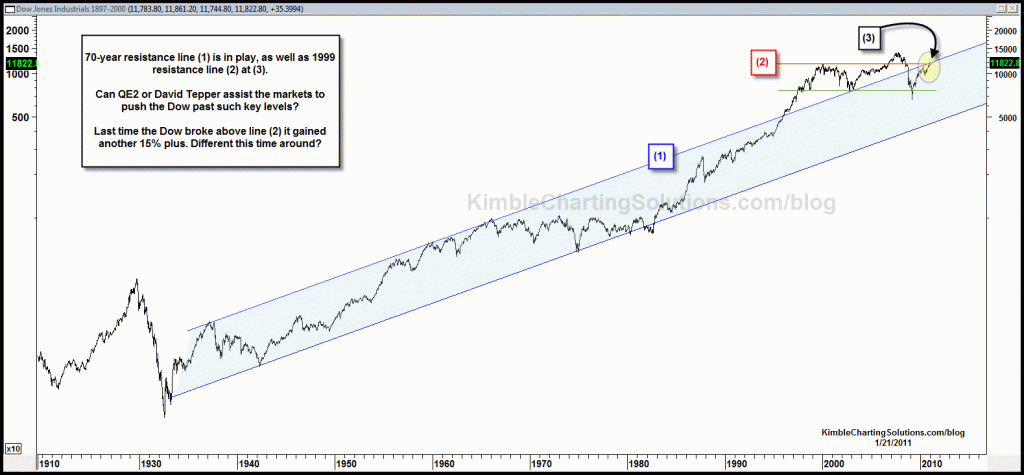
CLICK ON CHART TO ENLARGE Not only is 70-year channel resistance at hand, resistance based upon the 1999 high is at hand, at the same price point at (3). Resistance is resistance until broken in this long-term chart. The last time the Dow broke line (2) it...

by Chris Kimble | Oct 21, 2010 | Kimble Charting
Flirting with Disaster? Wouldn’t go that far. Flirting with ole Uncle Fibonacci? For sure!!! Euro and the Dow are flirting with the 61% retracement levels, with “bullish sentiment” at very high levels. Makes one glad to have harvested a few...


