
by Chris Kimble | Sep 6, 2017 | Kimble Charting
Oil Drillers have had little to smile about over the past years. Could this trend be about to end? A pattern is in play that highlights a counter trend rally could be near. Below looks at the Oil Drillers (XOP)/ S&P 500 Ratio over the past couple of years- CLICK...

by Chris Kimble | Feb 16, 2011 | Kimble Charting
The “Power of the Pattern” suggested to pick up the oil drillers ETF (OIH) on 1/26 (see post here) Since that post, OIH is currently up over $11 per share since the pattern suggestion. Drillers have done well, even though Crude has...

by Chris Kimble | Feb 2, 2011 | Kimble Charting
CLICK ON CHART TO ENLARGE Game Plan…am currently overweight the energy complex, long OIH and XLE. Keep a 4% stop on these positions. As relative strength continues (see post here) If the dollar should bounce off of support, I will lower this stop or...
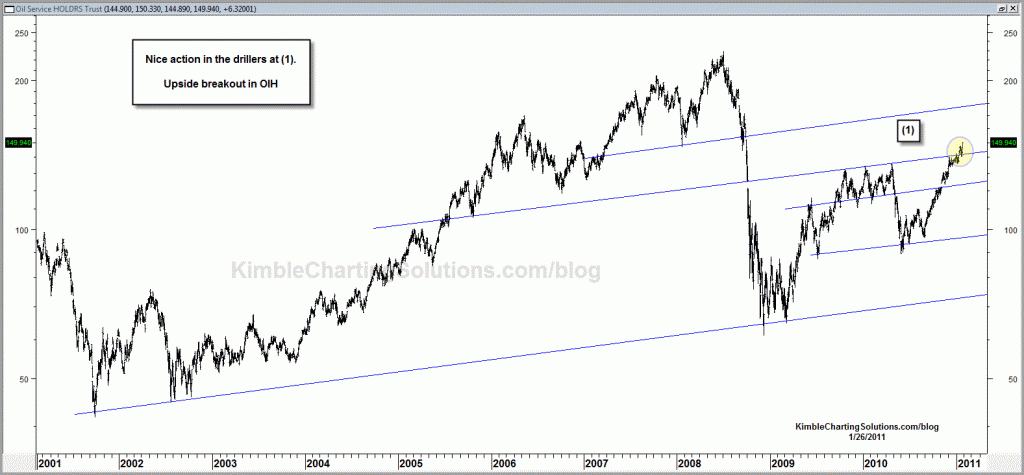
by Chris Kimble | Jan 26, 2011 | Kimble Charting
CLICK ON CHART TO ENLARGE Game Plan….am buying OIH with a 4% trailing stop…. will update the stop in the near future.
