by Chris Kimble | Feb 25, 2011 | Kimble Charting
CLICK ON CHART TO ENLARGE The U.S. Dollar currently finds itself touching a series of support lines at (3) in the chart above. Often times the Dollar has rallied when world tensions have increases, the so-called “flight to...

by Chris Kimble | Feb 15, 2011 | Kimble Charting
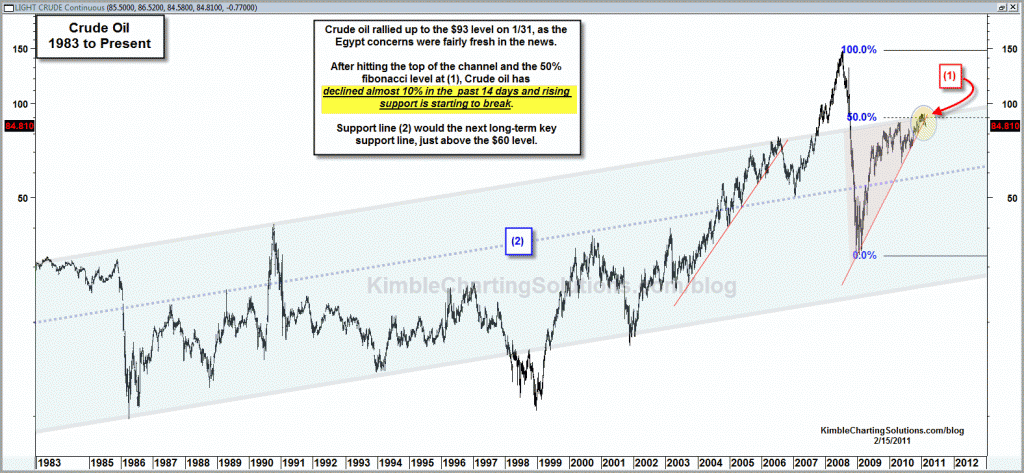
CLICK ON CHART TO ENLARGE Rising channel resistance dating back to the early 1980’s and fibonacci resistance both came into play at (1), about the time the news from Egypt took center stage. Crude oil has decline almost 10% in the past 14...

by Chris Kimble | Feb 8, 2011 | Kimble Charting
CLICK ON CHART TO ENLARGE Crude bounced off support prior to the news regarding Egypt. After hitting resistance Crude has declined $6 from the highs, in excess of 5%, despite the news from the Mid-east. Game Plan…Am picking up Crude on support...

by Chris Kimble | Jan 31, 2011 | Kimble Charting
Charts suggested to buy Oil Drillers ETF (OIH) last week (see post here) . In the chart below, Drillers (OIH) and Oil Stock ETF (XLE) have both broken channel resistance of late and are attempting to reach the next level of channel resistance. CLICK ON...


