
by Chris Kimble | Jul 9, 2015 | Kimble Charting
CLICK ON CHART TO ENLARGE Emerging markets ETF EEM doesn’t have much to brag about since 2007, as its down 30% from its highs It doesn’t have much to brag about the past three years either as its at the same price as it was in 2012, while so many market...

by Chris Kimble | Apr 6, 2015 | Kimble Charting
Is an important Paradigm Shift about to take place? Could be! For the past few years, the S&P 500 has been a much better asset to own when comparing performance against China, Hong Kong, Japan, South Korea and Emerging Markets. The 6-pack below looks at 5-ratios...

by Chris Kimble | Jun 2, 2014 | Kimble Charting
CLICK ON CHART TO ENLARGE The table below reflects that India has been doing very well so far this year, as its up 26%. That puts it 22% above the S&P 500 this year and 24% better than EEM, a popular Emerging markets ETF. CLICK ON CHART TO ENLARGE The top...

by Chris Kimble | Apr 21, 2014 | Kimble Charting
CLICK ON CHART TO ENLARGE When it comes to population, China represents one sixth of the worlds population. Does size matter? At this time it appears the Shanghai index is testing the underside of this flag/pennant pattern at (1) above. The Emerging markets ETF...

by Chris Kimble | Mar 31, 2014 | Kimble Charting
CLICK ON CHART TO ENLARGE Over the past month the S&P 500 is flat, no big deal. Over that same time period Brazil ETF EWZ is up 7.5%! Is a long-term trend change at hand in Brazil? Unless you live under a rock, you are well aware that BRIC countries have...

by Chris Kimble | Mar 4, 2014 | Kimble Charting
CLICK ON CHART TO ENLARGE Russia spent a few years and a few Dollars building the Olympic village and getting ready to host the games. Did Putin blow all that goodwill in a few days, after the closing ceremony? I will leave that up to others to debate. The...
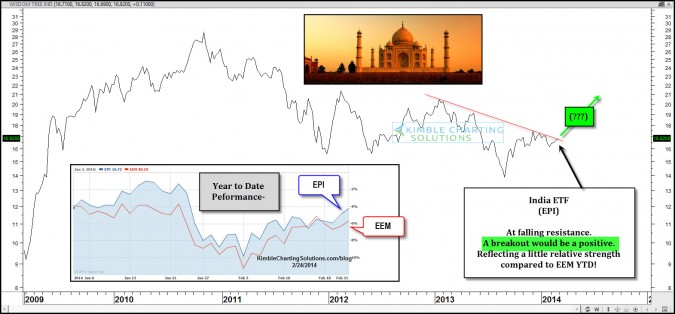
by Chris Kimble | Feb 24, 2014 | Kimble Charting
CLICK ON CHART TO ENLARGE Its been a rough few years for Emerging markets and India is no exception! From a shorter-term view India ETF (EPI) is reflecting some relative strength compared to EEM year to date, which has now brought it up against a year long...

by Chris Kimble | Jan 28, 2014 | Kimble Charting
CLICK ON CHART TO ENLARGE Turkey ETF (TUR) has declined 50% in the past year. The decline took it to support and has created a bullish falling wedge. Posted this chart on stocktwits a few hours ago (see here). This hard hit Emerging markets ready to rally? Many...
