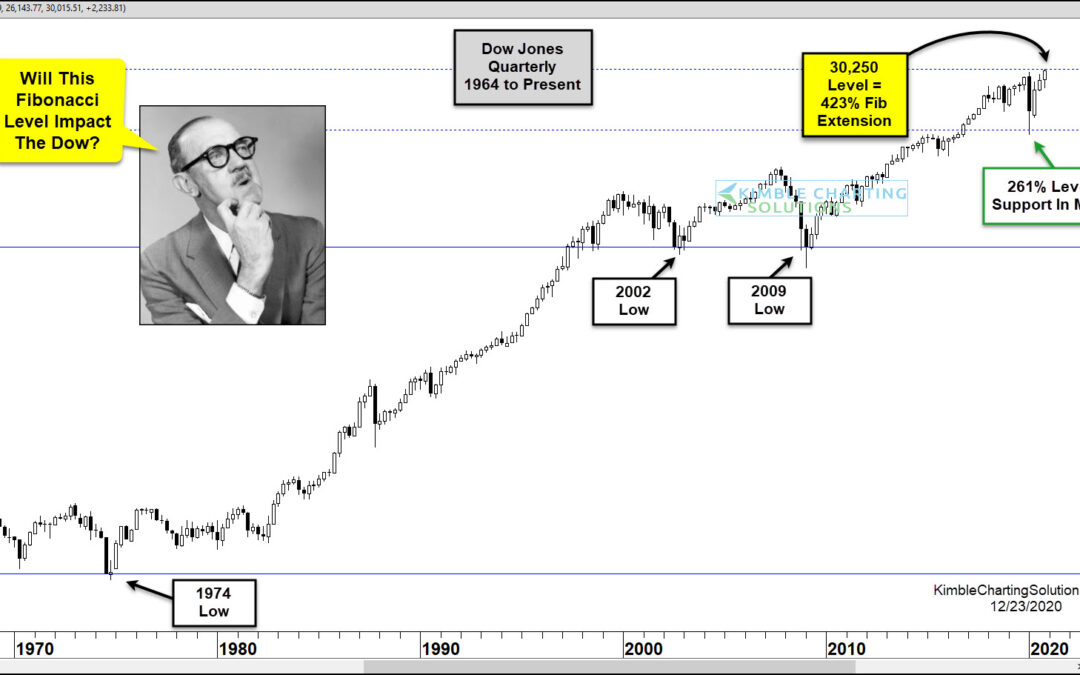
by Chris Kimble | Dec 23, 2020 | Kimble Charting
It’s truly amazing how important Fibonacci retracement and extension price levels are… and there’s no better place to highlight them than on a chart! Today we look at a long-term “quarterly” chart of the Dow Jones Industrial Average (since 1964). Using 1974 as a major...
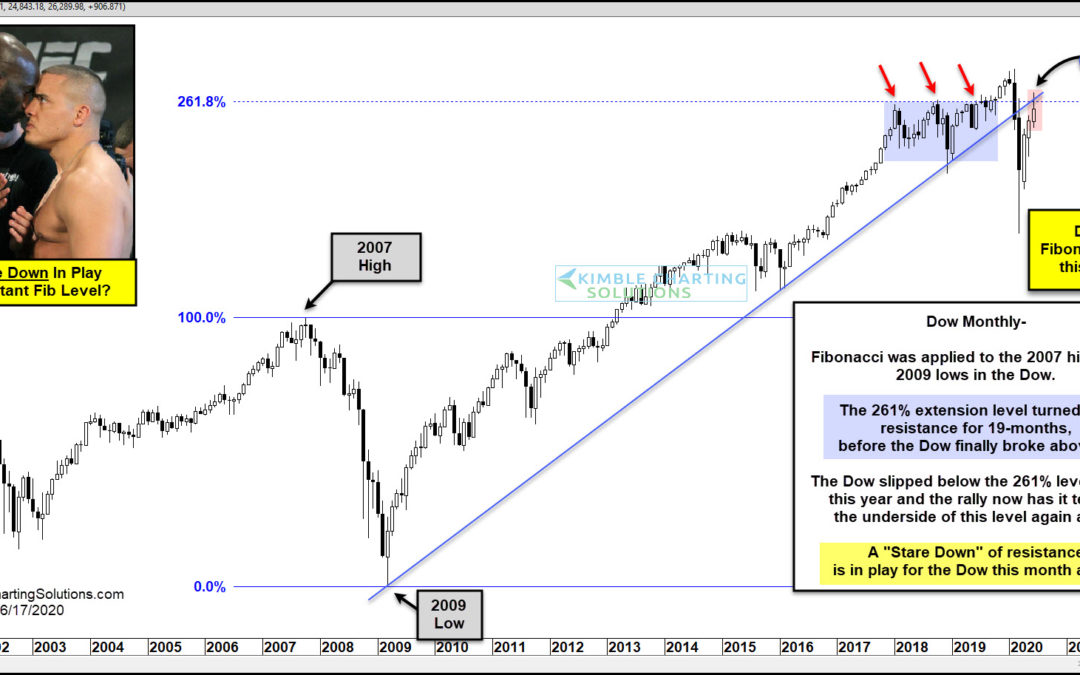
by Chris Kimble | Jun 17, 2020 | Kimble Charting
Is the Dow having a “Stare Down” with a key Fibonacci resistance level that was created by the 2007 highs and 2009 lows? Sure looks to be! This chart looks at the Dow Jones Index on a monthly basis over the past 20-years, where Fibonacci was applied to the...
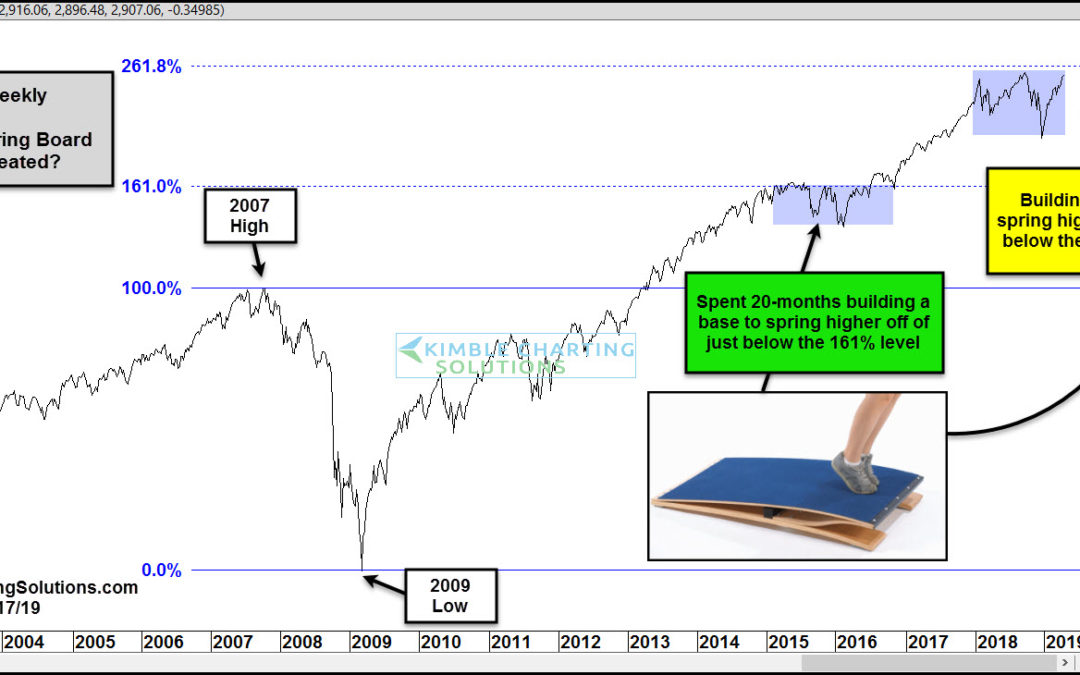
by Chris Kimble | Apr 17, 2019 | Kimble Charting
Is the S&P building a base to spring higher off of? Could be! This chart looks at the S&P 500, where Fibonacci was applied to the 2007 highs and 2009 lows. The S&P traded sideways just below the 161% Fibonacci extension level for nearly 20-months. In...
