by Chris Kimble | Feb 25, 2014 | Kimble Charting
CLICK ON CHART TO ENLARGE The Shanghai Index, Copper and Freeport McMoran look to be forming Descending triangle patterns. If you are unfamiliar with this pattern please read about them here Bottom line to this pattern, a break of support suggests a...

by Chris Kimble | Dec 6, 2012 | Kimble Charting
CLICK ON CHART TO ENLARGE Doc Copper and Freeport McMoran (FCX) , are great leading indicators for the macro picture and find themselves at or near critical support levels. Yesterday FCX fell hard, driving it down to a support line that has resulted in quality...

by Chris Kimble | Oct 22, 2012 | Kimble Charting
CLICK ON CHART TO ENLARGE Since late 2010, Freeport McMoran (FCX) has continued to get “hit on the head” each time it has come up to falling resistance line (1). Will FCX continue to be subjected to the “Whack a mole” game or will it be...

by Chris Kimble | Oct 3, 2012 | Kimble Charting
CLICK ON CHART TO ENLARGE FreePort (FCX) continues to make a series of lower highs over the past year and these highs have been around the time that Commodities peaked as well. For Commodities (CRB/CRX) to push higher, FCX needs to take out tough resistance line...

by Chris Kimble | Jul 18, 2012 | Kimble Charting
CLICK ON CHART TO ENLARGE The worlds largest Copper producer (FCX) could be forming a Head & Shoulders topping pattern and a descending triangle inside of the right shoulder. Doc copper and FCX often give leading global growth and contraction signals. ...

by Chris Kimble | Jun 28, 2012 | Kimble Charting
CLICK ON CHART TO ENLARGE Traders appear to have created bearish Head & Shoulders patterns in the Copper complex and Europe. Each asset in the 4-pack above reflects a similar pattern, as each looks to be testing their neckline! Even though each...

by Chris Kimble | Jun 22, 2012 | Kimble Charting
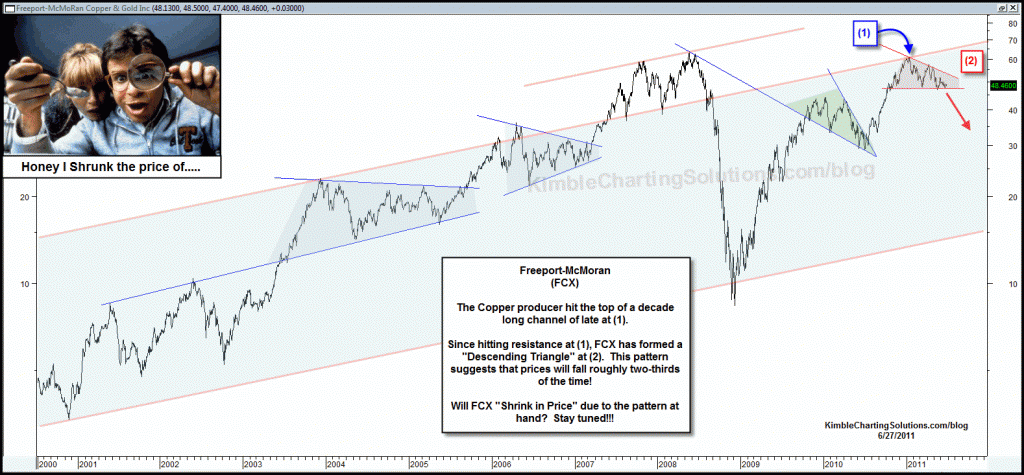
One year ago the Power of the Pattern was reflecting in the chart below, that a bearish descending triangle was taking shape in the worlds largest Copper producer, FCX. (see post here) What soon followed? FCX lost 37% of its value in 90 days! CLICK ON...

by Chris Kimble | Apr 19, 2012 | Kimble Charting
CLICK ON CHART TO ENLARGE Copper is often viewed as a global macro indicator. Freeport McMoran is the largest Copper producer in the world and its sure had is pricing challenges of late, as it is down over 30% from its 2011 highs. Of late it hit a rising support...


