by Chris Kimble | Aug 15, 2019 | Kimble Charting
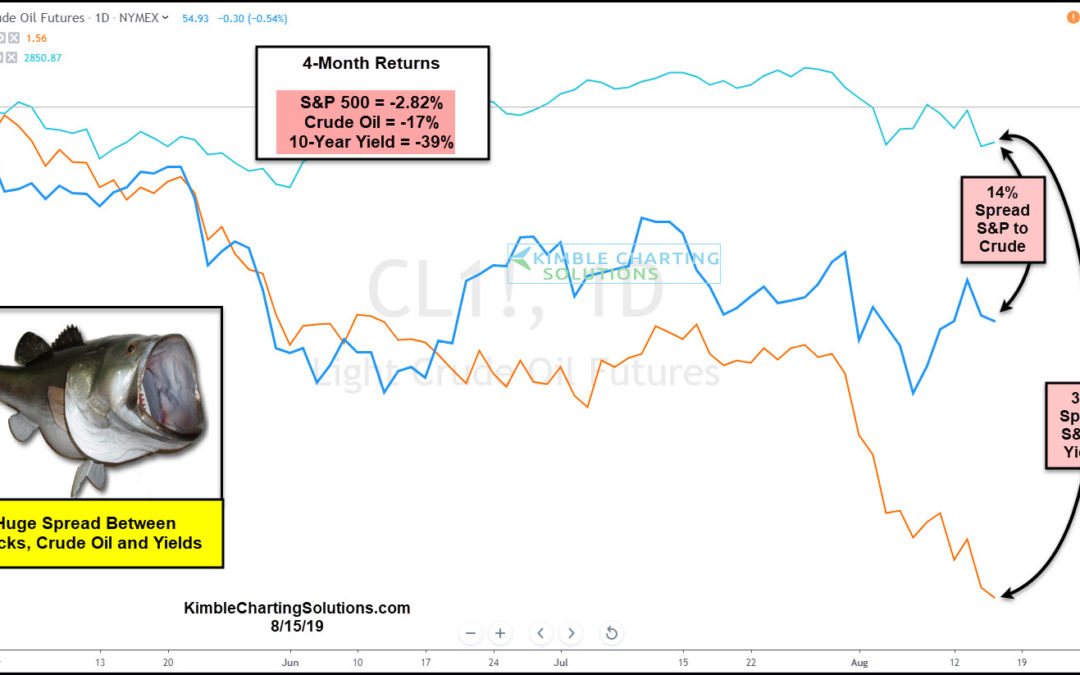
This chart looks at the performance of the S&P 500, Crude Oil and the Yield on the 10-Year note over the past 4-months. Crude Oil has declined around 14% more than the S&P during this time frame. Yields have declined, even more, around 36%. The is a huge...
