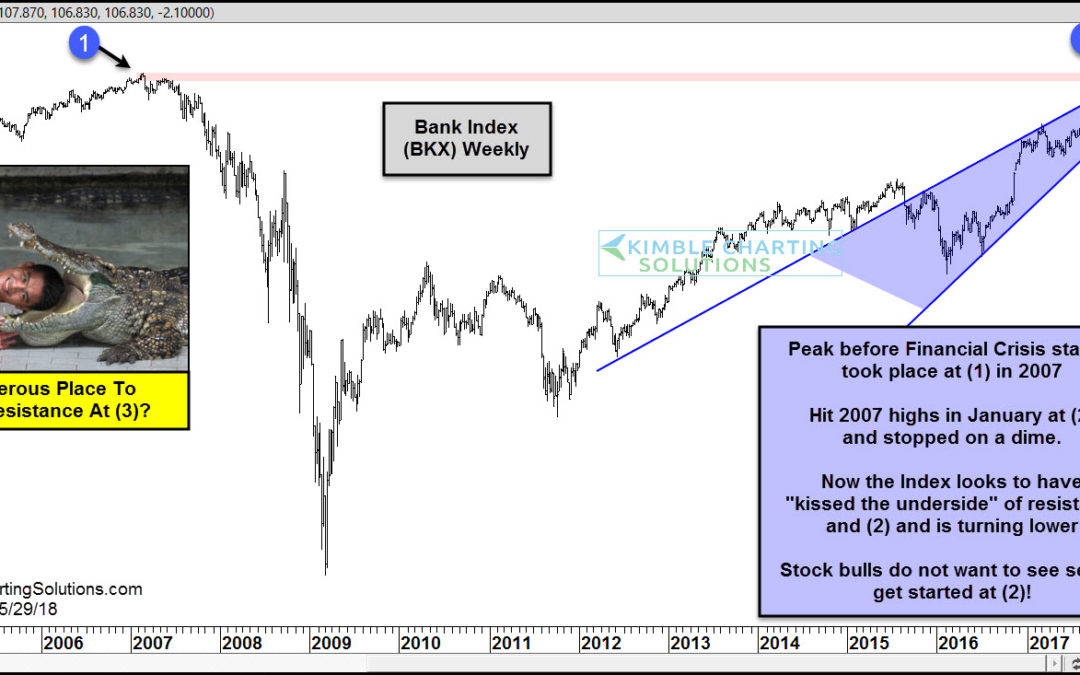
by Chris Kimble | May 31, 2018 | Kimble Charting
The banks always play a major role in the performance of the broader stock market indexes. On the bullish side of the ledger, the banking sector gives confidence to markets when it is outperforming or performing in line. On the bear side of the ledger, look no further...

by Chris Kimble | Apr 6, 2018 | Kimble Charting
CLICK ON CHART TO ENLARGE This chart looks at the Bank Index over the past 17-years on a monthly basis. The index has remained inside of a bullish rising channel (A) since the lows in 2011. The rally over the past 7-years took it to the top of this channel and back to...
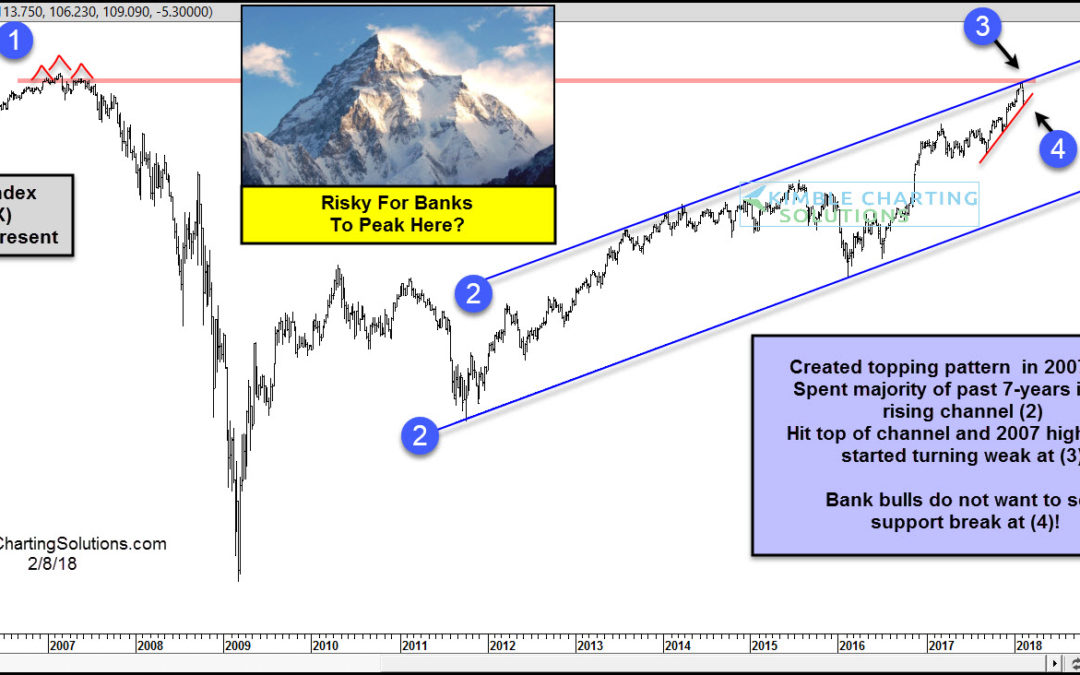
by Chris Kimble | Feb 8, 2018 | Kimble Charting
CLICK ON CHART TO ENLARGE The chart above looks at the Bank Index over the past 13-years. In 2007 at (1), the index created a topping pattern, prior to the financial crisis and its 80% decline over the next couple of years. The rally in banks over the past 7-years...

by Chris Kimble | Oct 24, 2017 | Kimble Charting
Some question if “Pigs Can Fly.” I don’t know if they can or can’t, of late though, Piggy Banks are flying high and breaking out. We have highlighted positive bank patterns of late and three weeks ago we shared that the banking sector was...

by Chris Kimble | Oct 19, 2017 | Kimble Charting
Earlier this week we sent this message to Premium and Sector Members and I wanted to share it with our viewership today. Below looks at the Bank Index (BKX) over the past 20-years and why the Power of the Pattern feels this could become a very important price point...
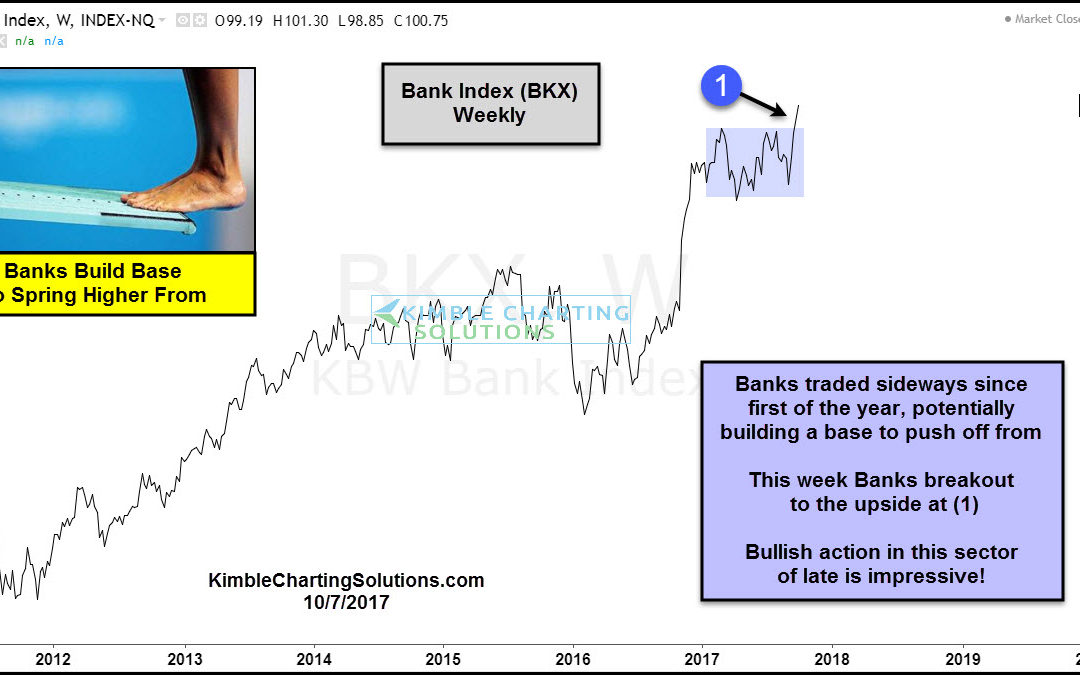
by Chris Kimble | Oct 7, 2017 | Kimble Charting
Since the first of this year, banks didn’t have much to brag about, as they lagged the broad market to the upside. While lagging, they potentially built a base that could reward the owners of banks for a while going forward. Below looks at the Bank Index (BKX)...
