
by Chris Kimble | May 15, 2013 | Kimble Charting
CLICK ON CHART TO ENLARGE Lumber has traded within a falling channel for the past 20-years. When lumber has hit the bottom of the channel, stocks have followed to the tune of 100% rallies twice. The key to this pattern is when Lumber is at the top of the channel...
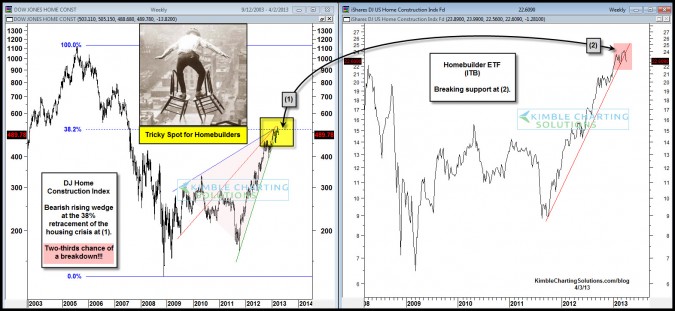
by Chris Kimble | Apr 3, 2013 | Kimble Charting
CLICK ON CHART TO ENLARGE Housing took the economy and the broad markets down back in 2006-2009. The DJ Home Construction index has created a multi-year bearish rising wedge pattern, with the apex of the pattern at its 38% Fibonacci retracement level at (1) above....

by Chris Kimble | Jan 11, 2013 | Kimble Charting
David Rosenberg wrote an article and produced the chart below, making the case that Homebuilder stocks look more overvalued now than they did at the housing bubble peak (see article here) CLICK ON CHART TO ENLARGE I will leave the valuation part to David and other...

by Chris Kimble | Nov 15, 2012 | Kimble Charting
CLICK ON CHART TO ENLARGE Unless one lives in a cave, most everyone knows Real Estate had a good deal to do with the economic and stock market weakness in 2007 & 2008. The DJ Home Construction index was a great “leading indicator” for the economy...

by Chris Kimble | Sep 11, 2012 | Kimble Charting
CLICK ON CHART TO ENLARGE The housing industry had a very negative impact on the broad market between 2005 to 2008, as the DJ home construction index lost 90% of its value in 3 years. The impact was far reaching. Since last fall the DJ home construction index has...

by Chris Kimble | Apr 18, 2012 | Kimble Charting
CLICK ON CHART TO ENLARGE It’s paid off to own the Financials/Regional Banks, Real Estate and Homebuilders the past 6-months, as they have taken on a leadership role and outperformed the S&P 500 by a wide margin, reflected in the chart above. Below is...

by Chris Kimble | Mar 23, 2012 | Kimble Charting
CLICK ON CHART TO ENLARGE Joe Fridays “Just The Facts”…. Homebuilder ETF (XHB) has doubled the S&P 500’s performance since the October lows and now the Dow Jone Home Construction Index finds itself at the top of sideways channel and up...

by Chris Kimble | Mar 13, 2012 | Kimble Charting
The “Power of the Pattern” shared on January 17th that a multi-year breakout was taking place in the crushed homebuilders sector, reflected in the chart below. (See 1/17 post here) CLICK ON CHART TO ENLARGE Below was the quiz from a couple...
