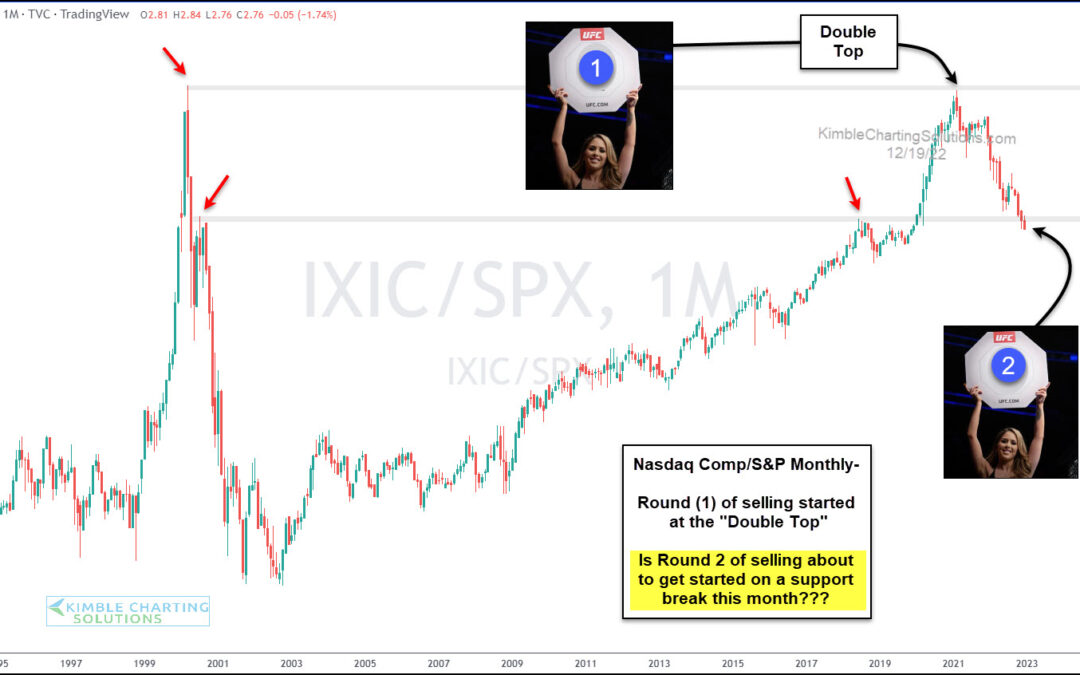
by Chris Kimble | Dec 20, 2022 | Kimble Charting
The past 5 days have seen another strong wave of selling across tech and growth stocks. Even more alarming is that tech stocks continue to underperform the broader market. And, as I have said many times, tech stocks have been a market leader for two decades… so it...
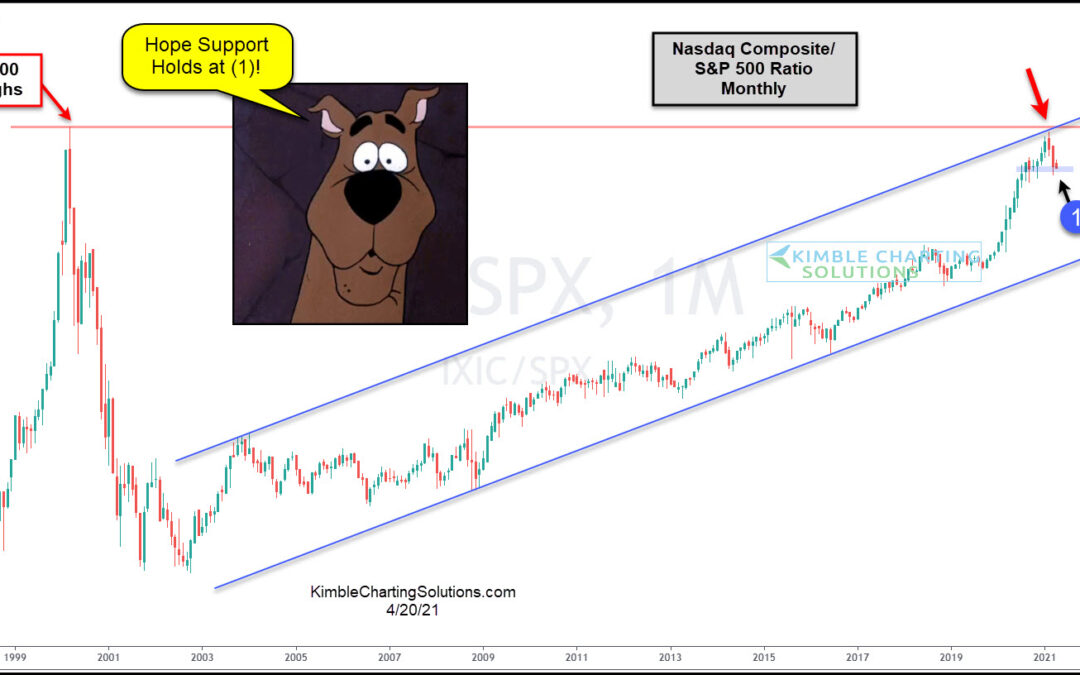
by Chris Kimble | Apr 20, 2021 | Kimble Charting
For the past 19-years, the Nasdaq Composite Index has been stronger than the S&P 500. Is this trend about to change? This chart looks at the Nasdaq Composite Index/S&P 500 ratio since 1997. It peaked in 2000 and fell like a rock, as tech stocks fell...
