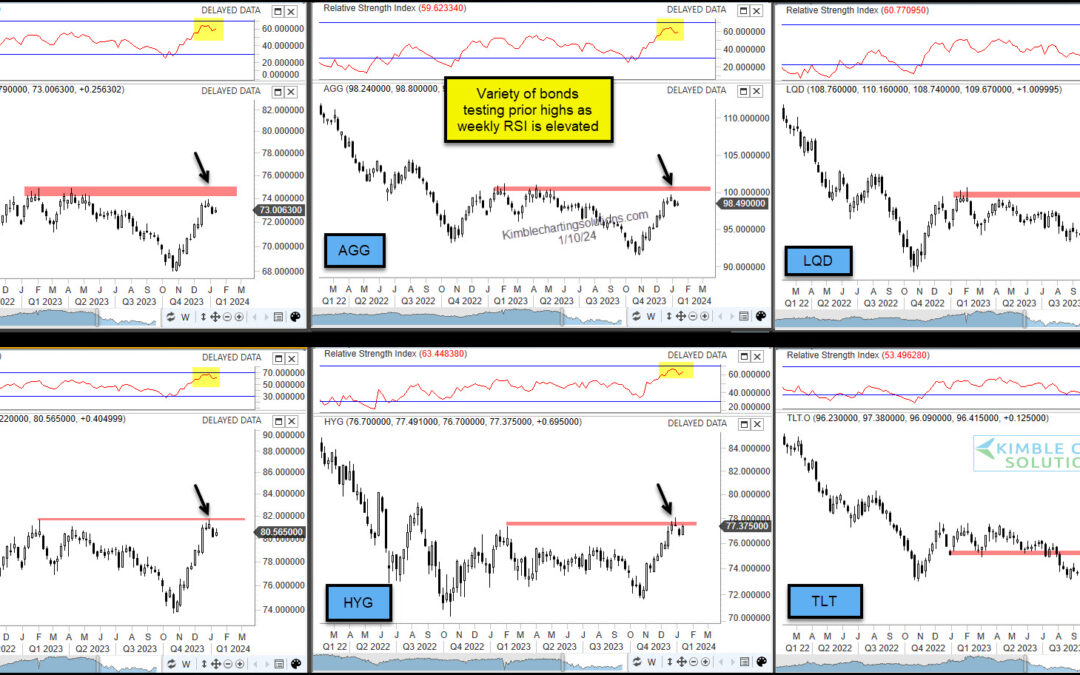
by Chris Kimble | Jan 11, 2024 | Kimble Charting
When interest rates fall, bond prices rise. And while it has been some time since we’ve been able to say interest rates are dropping, the past few months have done just that. The pullback in interest rates is coinciding with investors optimism that the Federal Reserve...
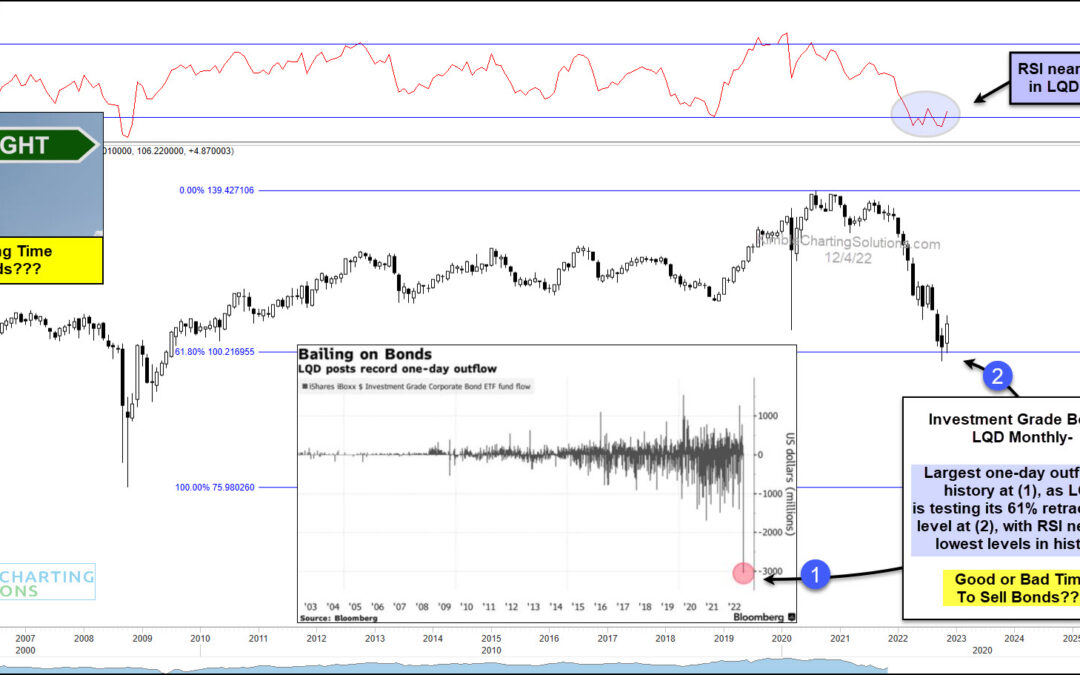
by Chris Kimble | Dec 6, 2022 | Kimble Charting
Considering our national debt and the debts of companies and consumers, it’s obvious that the bond market is critical to our economy. This is likely why the Investment Grade Bond ETF (LQD) started to sputter last year, well before the bear market in stocks this year....

by Chris Kimble | Mar 18, 2020 | Kimble Charting
Boring Investment Grade bonds could be sending a very important macro message of late! This chart looks at Investment Grade ETF (LQD) on a weekly basis over the past 20-years. LQD formed a bottom in late 2008, several months ahead of stocks. Following the 2008 low,...
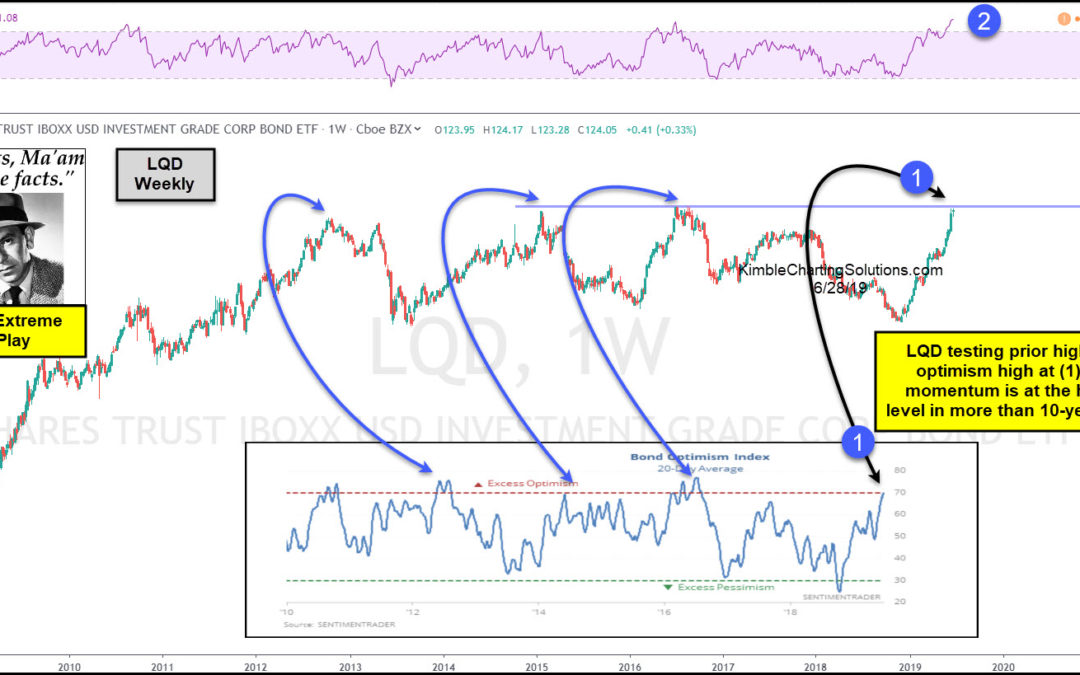
by Chris Kimble | Jun 28, 2019 | Kimble Charting
Are investment grade bonds peaking? Some conditions suggest its possible, says Joe Friday! This chart looks at Investment Grade Bond ETF (LQD) over the past 10-years. LQD has moved sharply higher since the lows in December of 2018. The rally has LQD testing its 2015...

by Chris Kimble | May 14, 2015 | Kimble Charting
CLICK ON CHART TO ENLARGE Did key bond ETF’s create long-term double tops over the past couple of years? The above 3-pack takes a look at three different bond ETF’s. AGG and LQD earlier this year attempted to break above 2012 highs. At this time it looks...
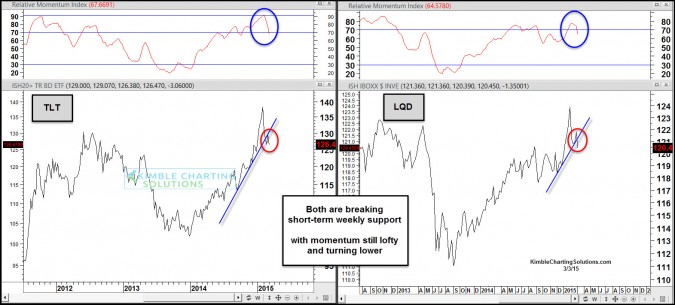
by Chris Kimble | Mar 3, 2015 | Kimble Charting
CLICK ON CHART TO ENLARGE Government Bond ETF TLT and Corporate Bond ETF LQD have done really well since the 2014 lows. Both are attempting to break short-term support with momentum lofty and curling lower. Trend change at hand or near? Bond and Utility (XLU) 10%...

by Chris Kimble | May 4, 2011 | Kimble Charting
The “Power of the Pattern” suggested a few weeks to own bonds (see post here). Now a breakout in bond prices looks to be taking place! CLICK ON CHART TO ENLARGE This breakout in bonds suggests that a flight to safety has been...
by Chris Kimble | Apr 19, 2011 | Kimble Charting
Some well known/very smart people are suggesting that bonds are not the place to be. Some are even shorting them! The chart below was last weeks quiz, where the “Power of the Pattern” was suggesting to “Buy Bonds” due...
