877-721-7217 services@kimblechartingsolutions.com
  • Twitter
  • Twitter
  • Terms of Use
  • Contact
0 Items
Kimble Charting Solutions
  • Blog Sign Up
  • Free Research (Blog)
  • Research Subscriptions
    • Most Popular Research
    • Premium Member Research
    • Weekly Research Reports
  • What We Do
    • What We Do For You
    • Charts Solve These Investing Challenges
    • What You Receive
  • About Us
    • About Us
    • Testimonials
    • Videos
    • As Seen On
  • Login
Select Page
Gold Miners about to blast off due to this potential bullish pattern?

Gold Miners about to blast off due to this potential bullish pattern?

by Chris Kimble | Jun 18, 2014 | Kimble Charting

  CLICK ON CHART TO ENLARGE Since March I have been sharing with members that miners looked to be creating a bullish inverse head & shoulders pattern and that the right shoulder needed to be completed. Premium & Metals Members that are aggressive...
Gold Bugs index poised to rally 150% again???

Gold Bugs index poised to rally 150% again???

by Chris Kimble | Apr 10, 2014 | Kimble Charting

  CLICK ON CHART TO ENLARGE Twice in the past 15 years the Gold Bugs/S&P 500 ratio was oversold (2001 & 2009), and the  Gold Bugs index ended up with rallies in excess of 150%.  The ratio remains deeply oversold at this time and the Gold bugs...
Is this the next key support price for Gold?

Is this the next key support price for Gold?

by Chris Kimble | Jun 26, 2013 | Kimble Charting

 CLICK ON CHART TO ENLARGE Almost two years ago the Power of the Pattern shared that Gold looked to be forming a Bearish Eiffel Tower pattern (see Gold Eiffel here) and that the Swiss Franc was suggesting Gold will be flat to down for years to come (see Franc...
Large bullish wick in this key metals stock just took place!

Large bullish wick in this key metals stock just took place!

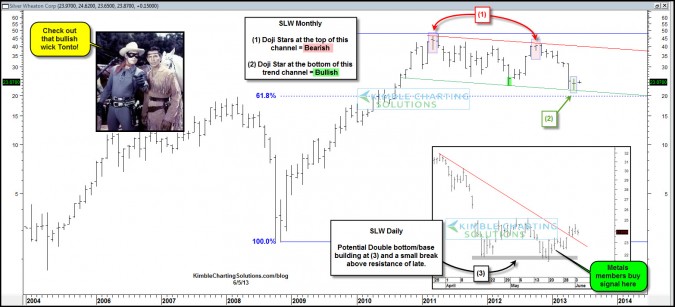
by Chris Kimble | Jun 5, 2013 | Kimble Charting

CLICK ON CHART TO ENLARGE Two weeks ago the Power of the Pattern reflected it was a good time for Short-term METAL MEMBERS to be a buyer of GDX with a stop below falling channel support line. The above chart looks at Silver Wheaton (SLW) which is the 4th largest...
Rare 8-year opportunity at hand in Gold…sentiment lowest in years!!!

Rare 8-year opportunity at hand in Gold…sentiment lowest in years!!!

by Chris Kimble | Apr 29, 2013 | Global Dashboard, Kimble Charting

CLICK ON CHART TO ENLARGE The above chart was shared with Premium Members last week.  The chart reflects a key line is at hand for Gold with bullish sentiment at one of the lowest readings in years. I am starting a “New Metals Research” report (see...

Topic Areas

10-year yield Apple Banks bonds China Commodities Copper CRB Index Crude Oil DAX Doc Copper Dollar Update Dow Jones Emerging Markets Euro GDX gdxj gld gold Gold Bugs Gold Stocks Govt. bonds High Yields Interest Rates Joe Friday Junk Bonds Kimble Charting King Dollar NASDAQ 100 ndx 100 NYSE Composite QQQ Russell 2000 S&P S&P 500 Shanghai index silver slv SPX spy TLT US dollar What would you do? Wilshire 5000 Yields
  • Terms of Use
  • Contact
  • Twitter

Copyright ©2023 Kimble Charting Solutions. All Rights Reserved | Design by 16Wells