by Chris Kimble | Dec 17, 2019 | Kimble Charting
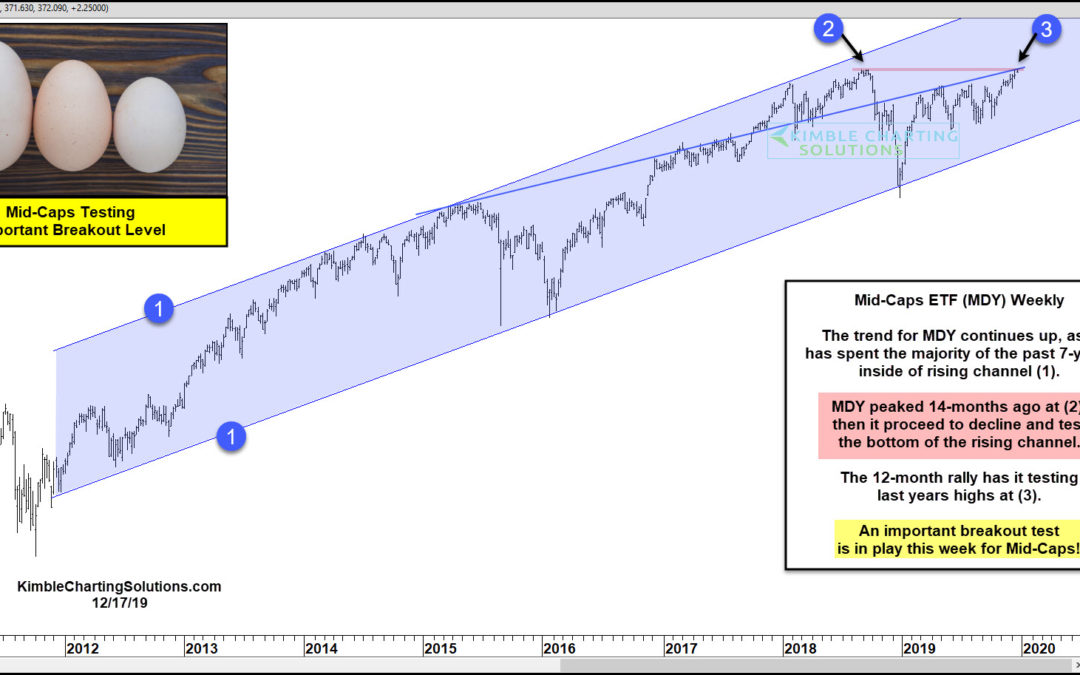
Are lagging Mid-Caps about to send a bullish message to the broad markets? Looks like we will find out soon. The S&P 500 is over 9% above the highs of last September. The same can not be said for Mid-Caps! This chart looks at the Mid-Cap ETF (MDY) over the past...
by Chris Kimble | Aug 7, 2019 | Kimble Charting
Stock Market Indexes Topping? Well, that was fast. The stock market pullback has been sharp and likely is not over yet. Last week, I shared the same chart, calling it a “moment of truth” for the stock market. Would the 3 underperforming stock market indexes (in the...
by Chris Kimble | Jul 31, 2019 | Kimble Charting
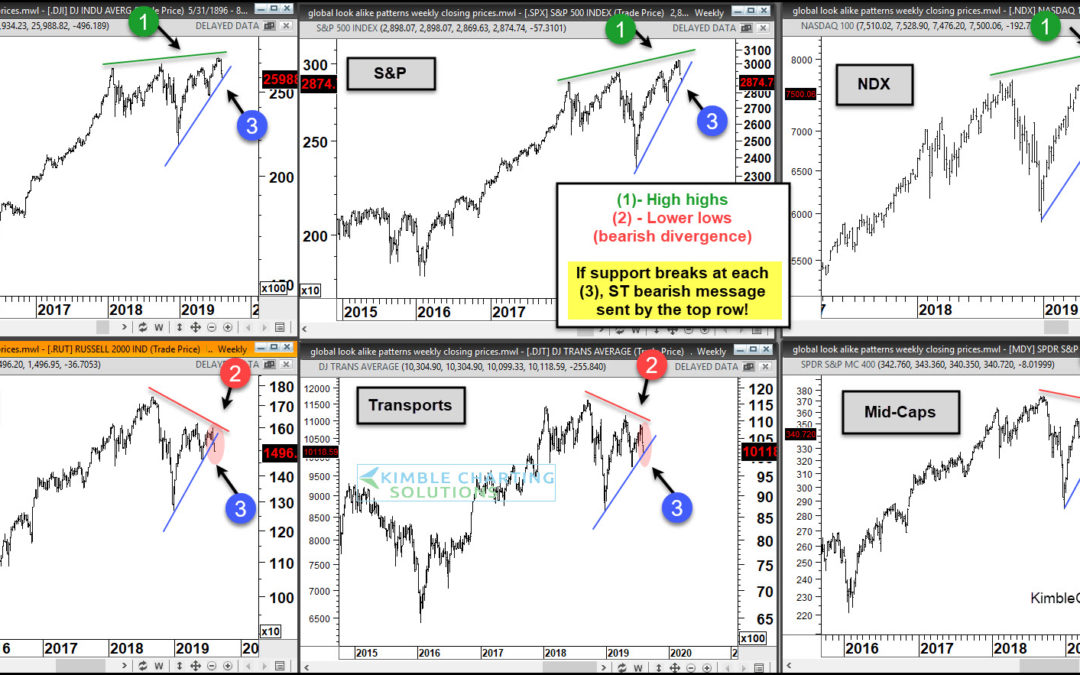
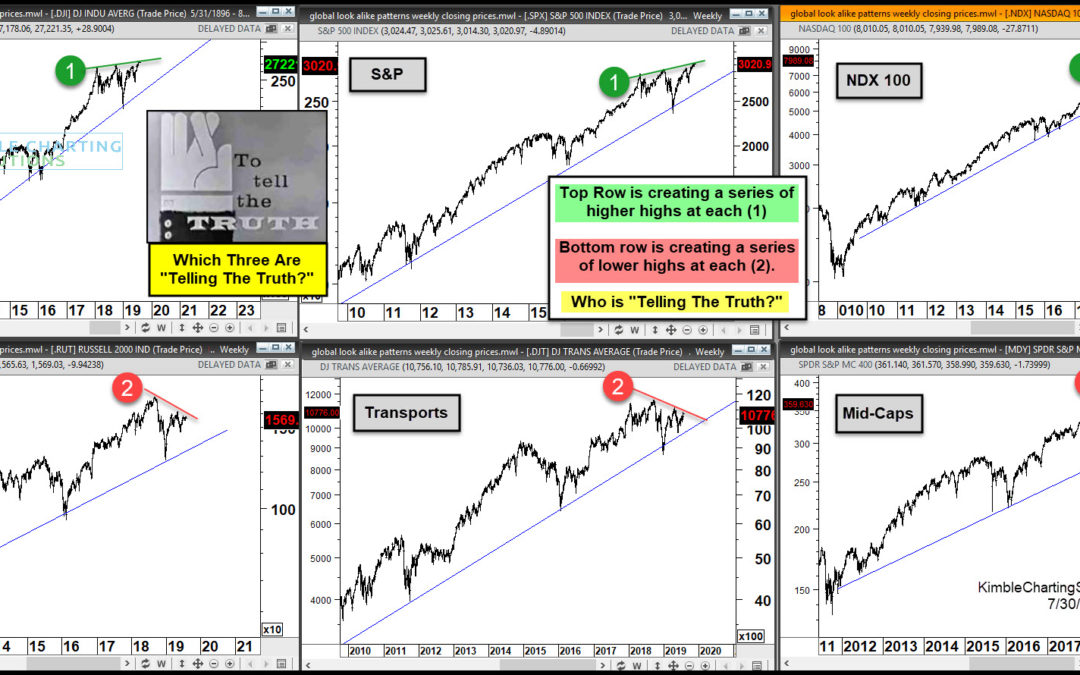
As investors prepare for the Federal Reserve announcement today, they are feeling pretty good. That’s mostly due to the performance of the “big 3” stock market indexes: the S&P 500 IndexINDEXSP: .INX, Dow Jones IndustrialsINDEXDJX: DJI, and the NasdaqINDEXNASDAQ:...
by Chris Kimble | Jan 18, 2019 | Kimble Charting
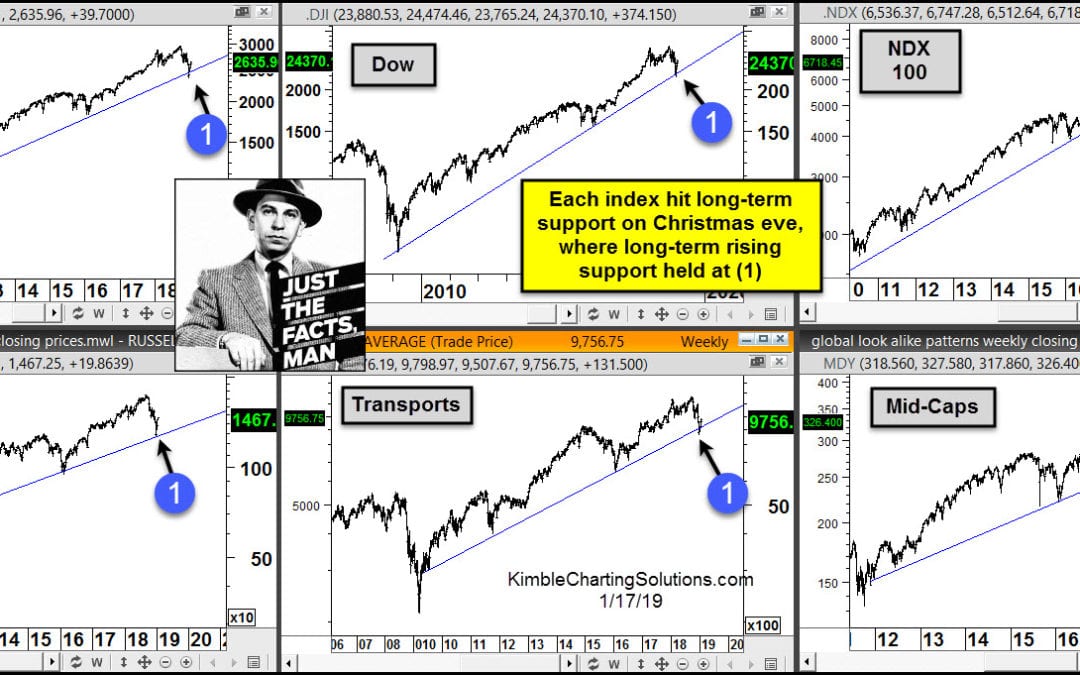
We often hear “Stocks take an escalator up and an elevator down!” No doubt stocks did experience a swift decline from the September highs to the Christmas eve lows. Looks like the “elevator” part of the phrase came true as 2018 was coming to an...
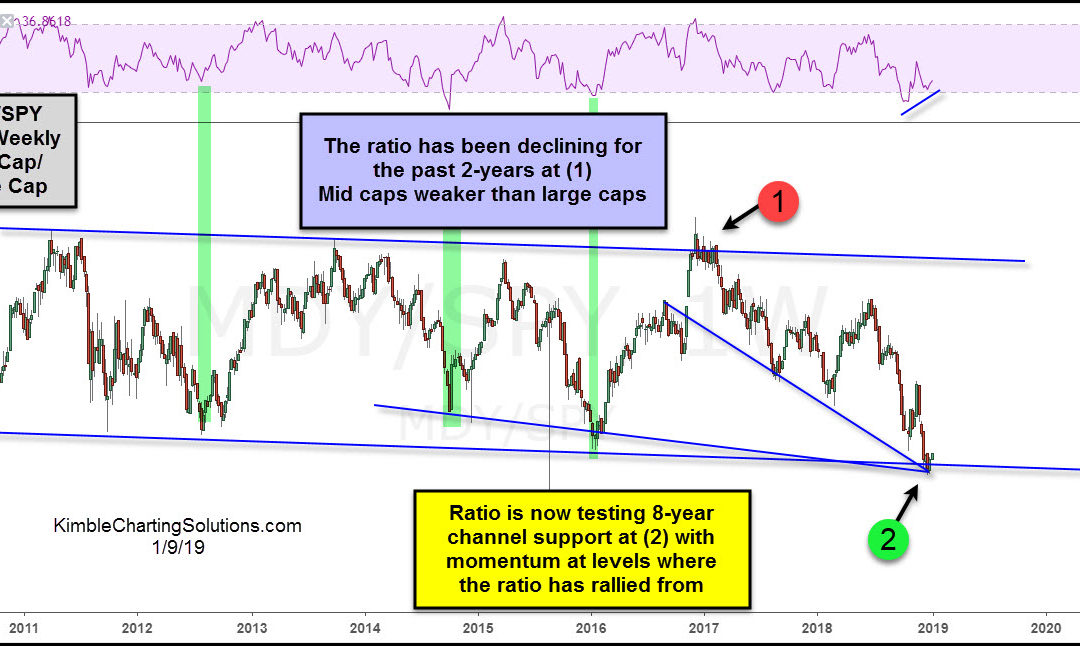
by Chris Kimble | Jan 9, 2019 | Kimble Charting
Mid-cap stocks have been underperforming large-cap stocks for quite some time. Perhaps, this is a reason for the malaise in the broader market over the past year. Let’s take a closer look at what’s happening. In the chart below, we look at the performance ratio of...
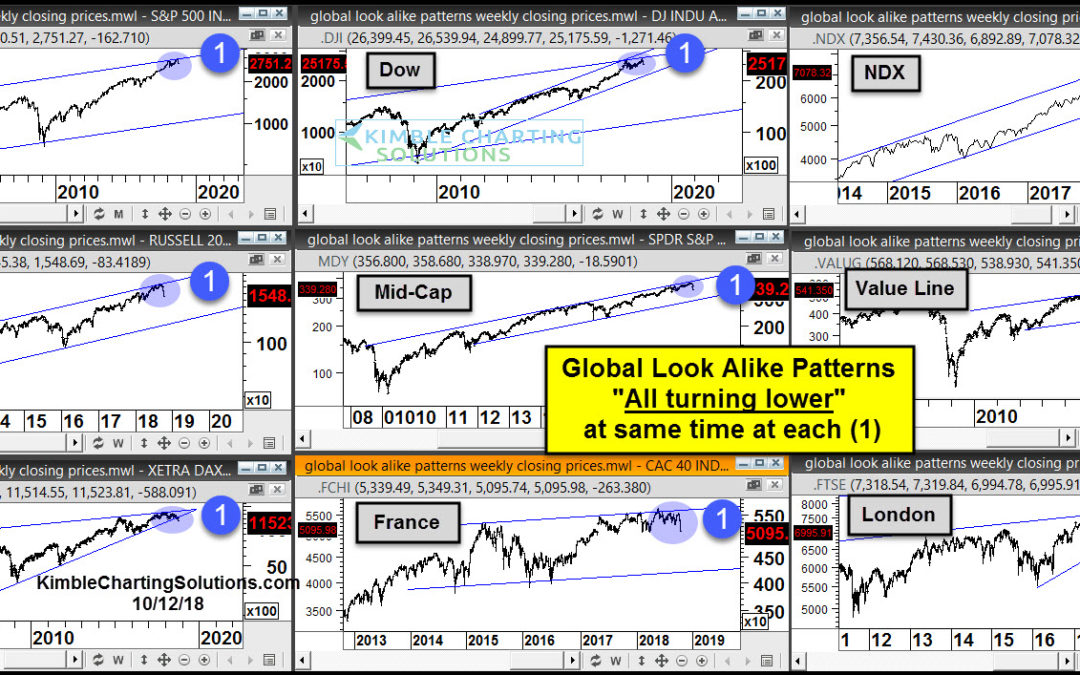
by Chris Kimble | Oct 18, 2018 | Kimble Charting
Over the past several weeks, I’ve shared several examples of key stock market indexes and indicators hitting long-term resistance. Today, we’ll do the same… but with a much wider lens. We’ll look at 9 different stock market indexes in the developed markets that look...
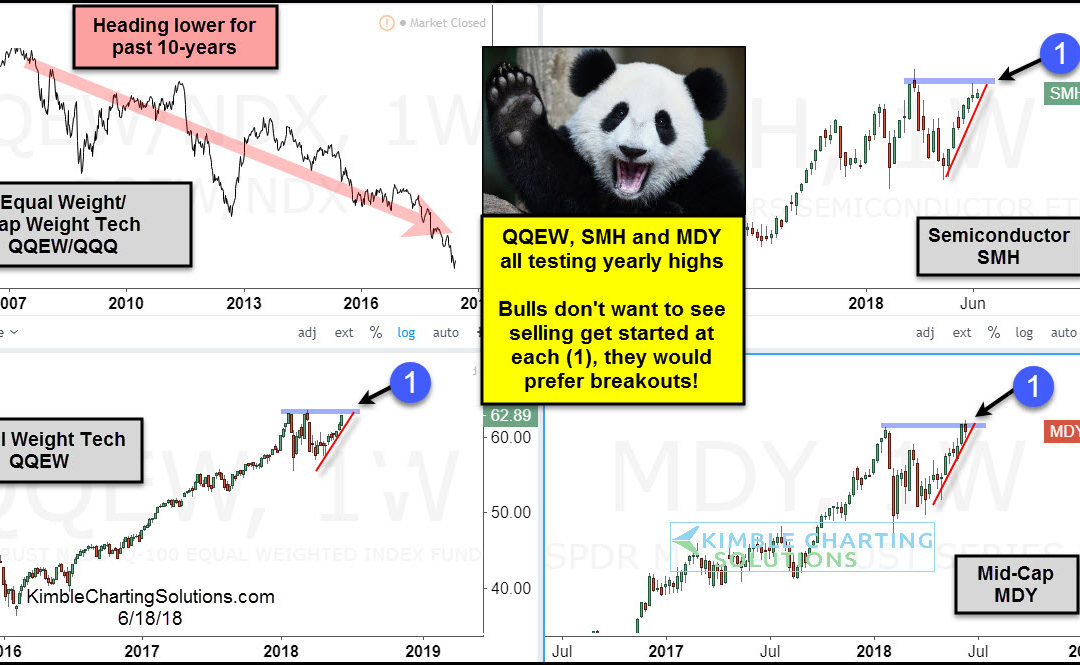
by Chris Kimble | Jun 18, 2018 | Kimble Charting
CLICK ON CHART TO ENLARGE The Trend for the Nasdaq and Semiconductors remains up, as each is near all-time highs and both are reflecting relative strength over the broad markets. Ths 4-pack above looks at some key price points for Tech and Mid-Caps that are in play at...
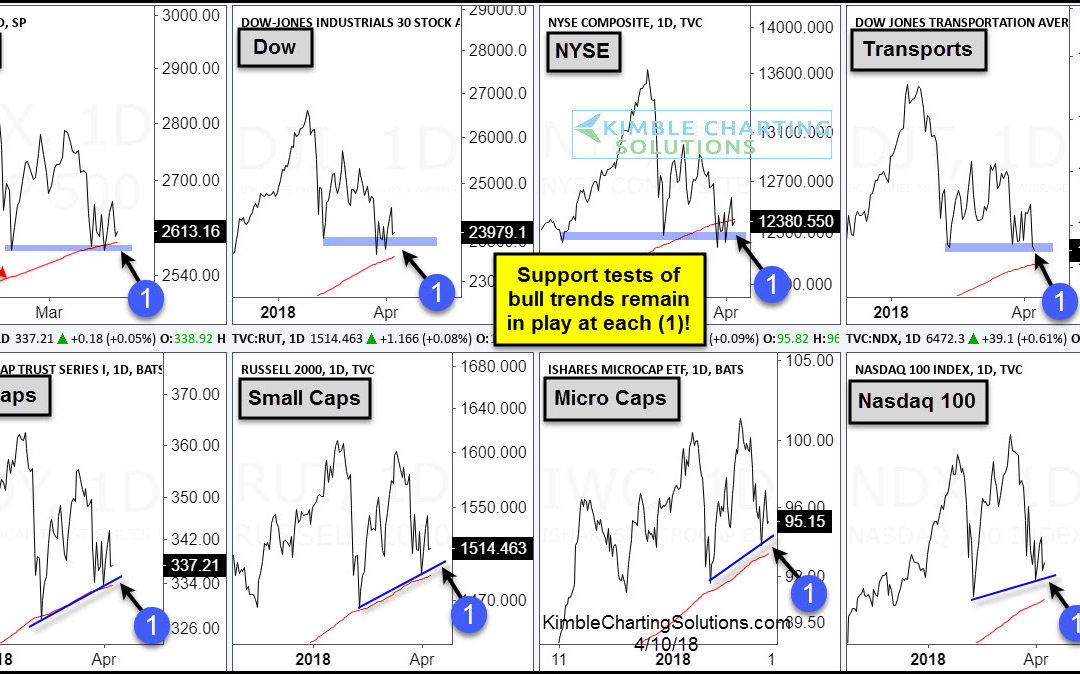
by Chris Kimble | Apr 10, 2018 | Kimble Charting
CLICK ON CHART TO ENLARGE The chart above looks at performance numbers of several key indices on a Year-To-Date basis and from the highs in January. Both highlight that these indices are soft and mostly choppy so far this year. The 8-pack below looks numerous stock...
