by Chris Kimble | Mar 2, 2018 | Kimble Charting
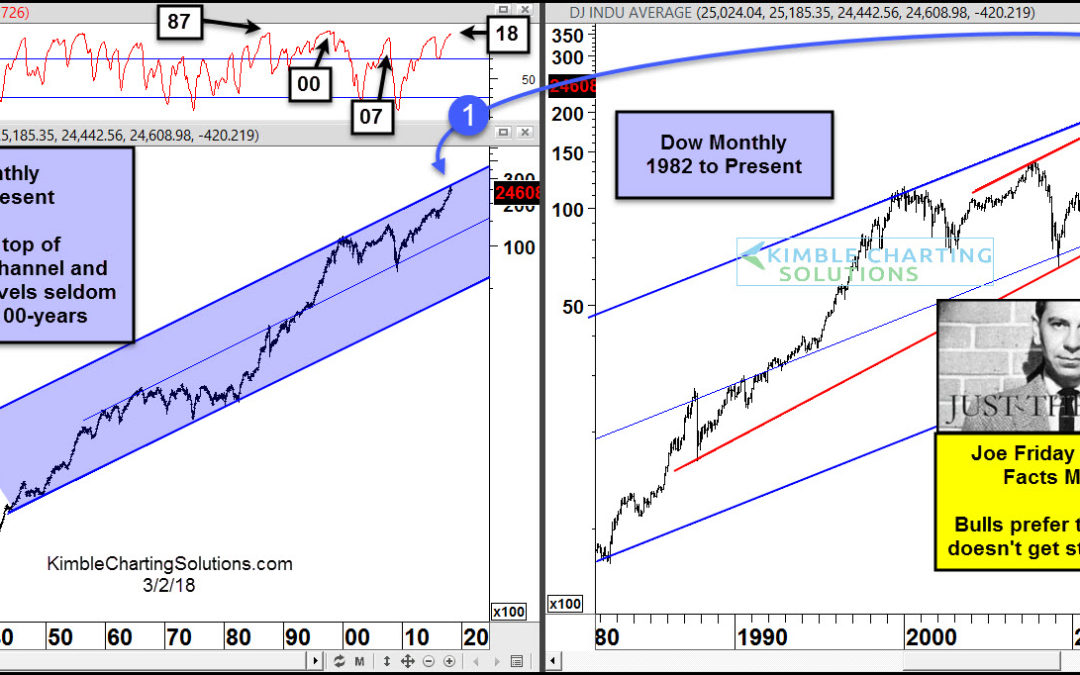
CLICK ON CHART TO ENLARGE The 2-pack above looks at the Dow from two different time frames. 100-year look back on the left and 35-year look back on the right. As you can see the Dow is in a very strong and well defined rising bull trend! Nothing of late has changed...

by Chris Kimble | Jun 13, 2017 | Kimble Charting
The S&P 500 has done well this year, up almost 8% as we approach the half way point of the year. Mid, Small and Micro caps can’t say the same performance wise, as each is lagging large caps so far this year. See chart below. CLICK ON CHART TO ENLARGE Could...

by Chris Kimble | Dec 22, 2015 | Kimble Charting
CLICK ON CHART TO ENLARGE Mid-Cap 400 (MDY) and Russell Small Cap 2000 (RUT) remain inside of clean multi-year rising channels. Each has made a series of lower highs since the peaks this past summer. It has paid to buy each of these on rising support, will it be...

by Chris Kimble | Apr 22, 2015 | Kimble Charting
CLICK ON CHART TO ENLARGE When looking at performance over the past 1, 2 and 5-year time frames, the NDX 100 has out performed the S&P 500 and Small Caps (Russell 2000) in each of these time windows. The chart below looks at the performance over the past 5-years....

by Chris Kimble | Mar 16, 2015 | Kimble Charting
CLICK ON CHART TO ENLARGE I applied Fibonacci extension levels to the 2002 lows and 2011 highs in Mid Caps. The 161% Fibonacci extension level looked to create some resistance, as Mid Caps chopped around this level for 5-months last year. Mid-Caps finally broke above...

by Chris Kimble | Mar 14, 2015 | Kimble Charting
CLICK ON CHART TO ENLARGE The above table looks at returns over the past 100 days (actually 103 days). It feels like the broad market has done OK of late, yet when looking at performance, the S&P has been rather flat. Actually really flat (0%), according to data...

by Chris Kimble | Mar 2, 2015 | Kimble Charting, Sector / Commodity
CLICK ON CHART TO ENLARGE Above are markets that are starting this month at all-time highs. Only the Nikkei is not at an all-time high, it did finish last month at a new monthly high, surpassing the highs hit in 2007. Historically, having numerous markets closing at...

by Chris Kimble | Feb 17, 2015 | Kimble Charting
CLICK ON CHART TO ENLARGE A good number of people invest in stocks with a common goal, grow their nest egg and beat the cost of living. The above chart looks at large, mid-caps, small-caps and tech stocks performance since 2000, net of inflation. The clear...


