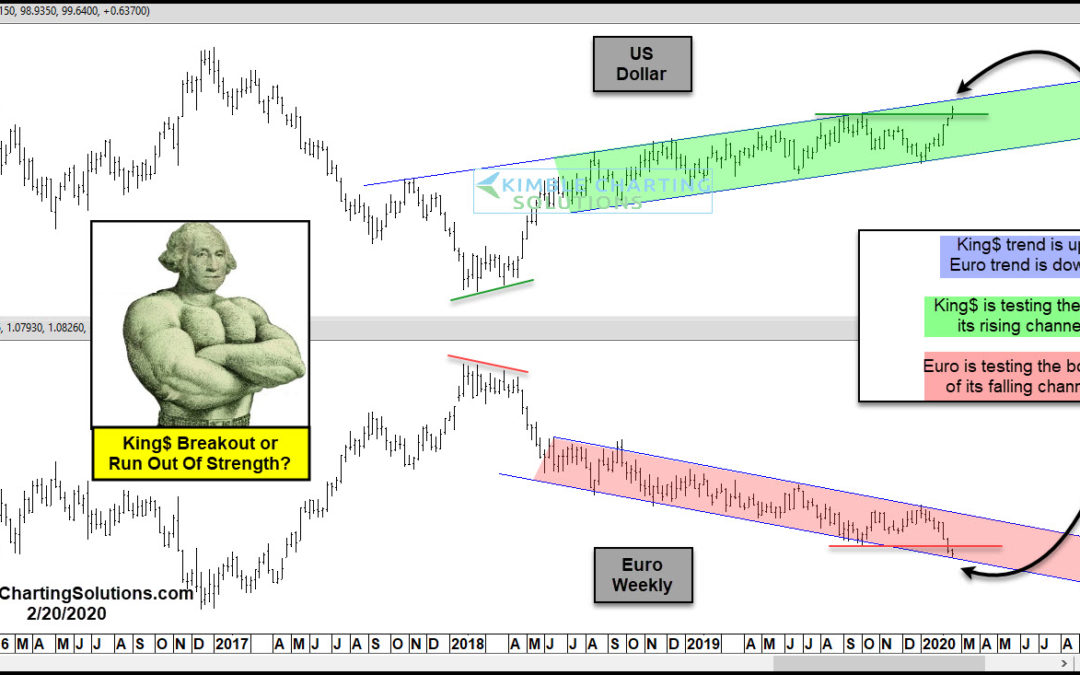
by Chris Kimble | Feb 20, 2020 | Kimble Charting
Is King$ and the Euro facing important breakout/breakdown tests at the same time? It looks like it in this chart! The US$ trend remains up, as it has created a series of higher lows since the start of 2018. The opposite can be said for the Euro, as it has created a...
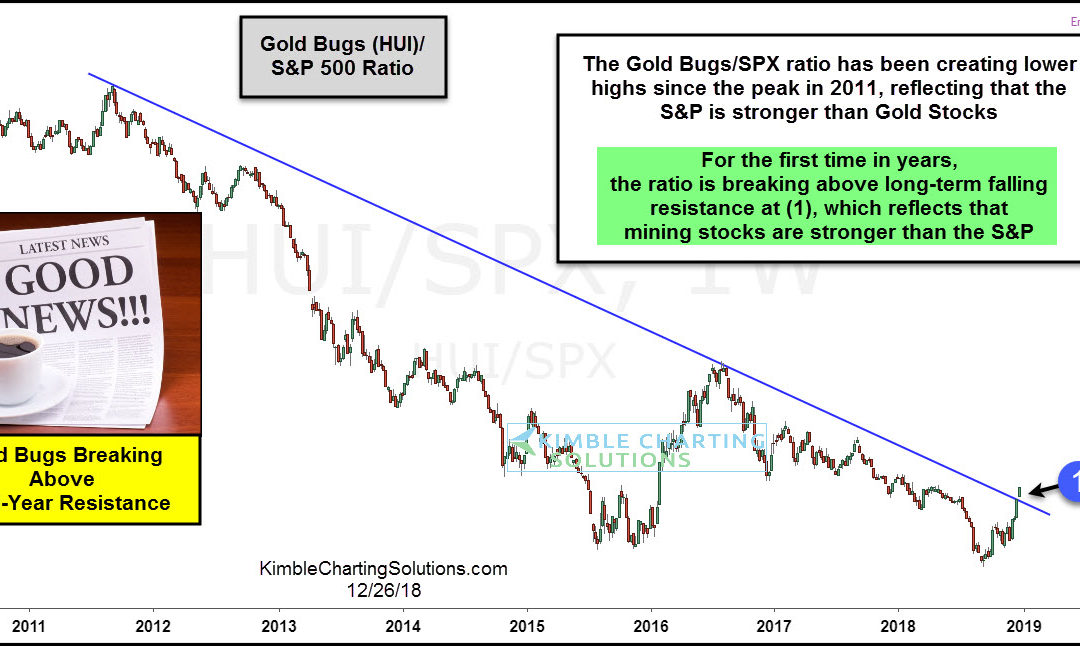
by Chris Kimble | Dec 26, 2018 | Kimble Charting
The Gold Bugs Index could be sending some good news to this out of favor sector of late! The Gold bugs index has struggled for the past 7-years compared to the S&P 500, as it has created a series of lower highs. This decline reflects that Gold miners have been...
by Chris Kimble | Jan 12, 2018 | Kimble Charting
Below looks at the ratio of Silver to Gold over the past 30-years. Metals bulls historically receive a bullish message when this ratio is moving higher. Back in 2011, the ratio hit highs that took place in the early 1980’s and its been downhill for Gold and...
by Chris Kimble | Aug 15, 2017 | Kimble Charting
The US Dollar so far this year, has been very week, losing nearly 10% of its value. This decline might have influenced investors to go long the Euro. Below looks at sentiment towards the Euro, that we shared on our Twitter & Stocktwits accounts 9-days ago. CLICK...

by Chris Kimble | Jun 6, 2017 | Kimble Charting
Is a new bull market in metals about to “Get Started?” Lets look at one indicator that is attempting to send a bullish signal, for the first time in 6-years. Below looks at the Gold Futures/US Dollar ratio, since 1999 on a weekly basis- CLICK ON CHART TO...
