by Chris Kimble | Feb 9, 2018 | Kimble Charting
Below looks at the Dow Jones Industrial average over the past 100-years. The long-term of the Dow remains up. The action of the past couple of weeks has NOT changed that fact. We do find this interesting-The Dow Industrials finally moved into correction territory...

by Chris Kimble | Jul 25, 2014 | Kimble Charting
CLICK ON CHART TO ENLARGE It usually takes an extended bull market to push “Monthly Momentum” to lofty levels. The above 2-pack looks at the S&P 500 and the DJ Transports on a monthly basis, back to the early 1980’s. The upper lines...

by Chris Kimble | Oct 31, 2013 | Kimble Charting
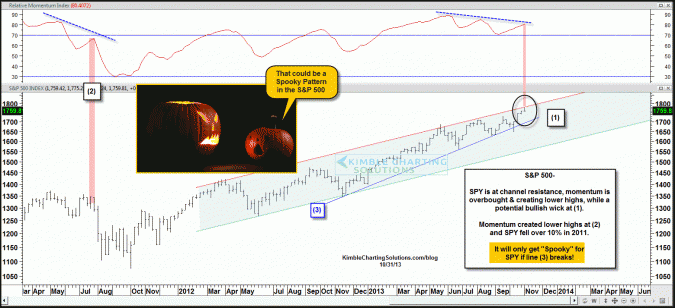
CLICK ON CHART TO ENLARGE The S&P 500 is at the top of a 22 month channel and could be creating a bearish wick this week. That in and of itself is NOT spooky for this key index. What investors need to pay attention too is diverging momentum, as it makes lower...


