by Chris Kimble | Sep 1, 2020 | Kimble Charting
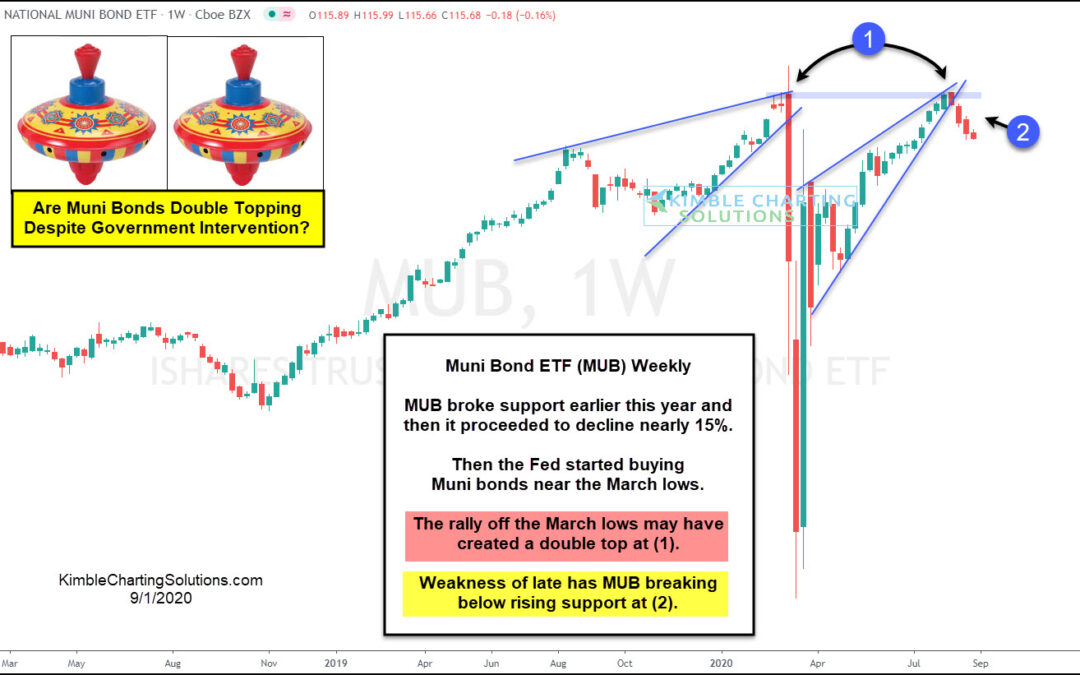
In March, after a 15% decline in Muni bond prices and as part of its response to COVID-19, the Federal Reserve announced it would for the first time in its history enter the municipal bond market. Following the announcement of the Feds purchasing plans, Muni bonds...

by Chris Kimble | Aug 13, 2013 | Kimble Charting
CLICK ON CHART TO ENLARGE A wide variety of bonds have been under pressure since their May highs. This doesn’t just apply to Government bonds! The above 4-pack reflects a cross section of bonds (Govt, High Quality Corp & Junk Bonds) that have been weak...

by Chris Kimble | Jun 4, 2013 | Kimble Charting
CLICK ON CHART TO ENLARGE Muni bonds yield Tax Free income, yet the National Muni bond ETF (MUB) is “NOT Free from losing value of late!” Tom Petty best describe MUB? A bearish rising wedge formed, suggesting a two-thirds chance of lower prices ahead...

by Chris Kimble | Mar 10, 2013 | Kimble Charting
CLICK ON CHART TO ENLARGE Muni Bond ETF (MUB) is breaking its second support line and its 200-SMA line at (1) this past week. Is it doing something other bonds are not? Diversified Bond ETF (AGG) is close to breaking support of a multi-year rising channel in the...

by Chris Kimble | Mar 3, 2011 | Kimble Charting
Heated debate seems to be common in the Muni bond arena of late, due to a few predictions that Muni’s are in big trouble going forward. Whether the predictions come true or not, the “Power of the Pattern” is suggesting certain action should be...

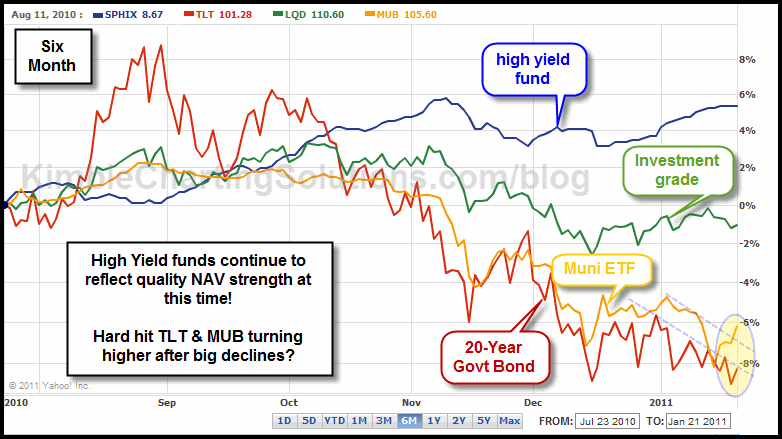
by Chris Kimble | Feb 4, 2011 | Kimble Charting
CLICK ON CHART TO ENLARGE Bond relative strength remains in the hands of the high yield funds/etf’s, compared to many other types of bonds. I have continued to suggest the high yield bonds for months and until prices break support and moving...
by Chris Kimble | Jan 24, 2011 | Kimble Charting
CLICK ON CHART TO ENLARGE Have been a fan of the price action of high yields for months. Price action in the high yield fund complex remains a positive. TLT and MUB have had a rough go of it recently. Buy low/Sell high something to consider in these...

by Chris Kimble | Nov 15, 2010 | Kimble Charting
Yields are starting to jump all over the place and are clearing key resistance levels in many different types of bonds! Below the Yield on the 10-year note looks to have made an inverse “Head & Shoulders” pattern! CLICK ON CHART TO ENLARGE This...
