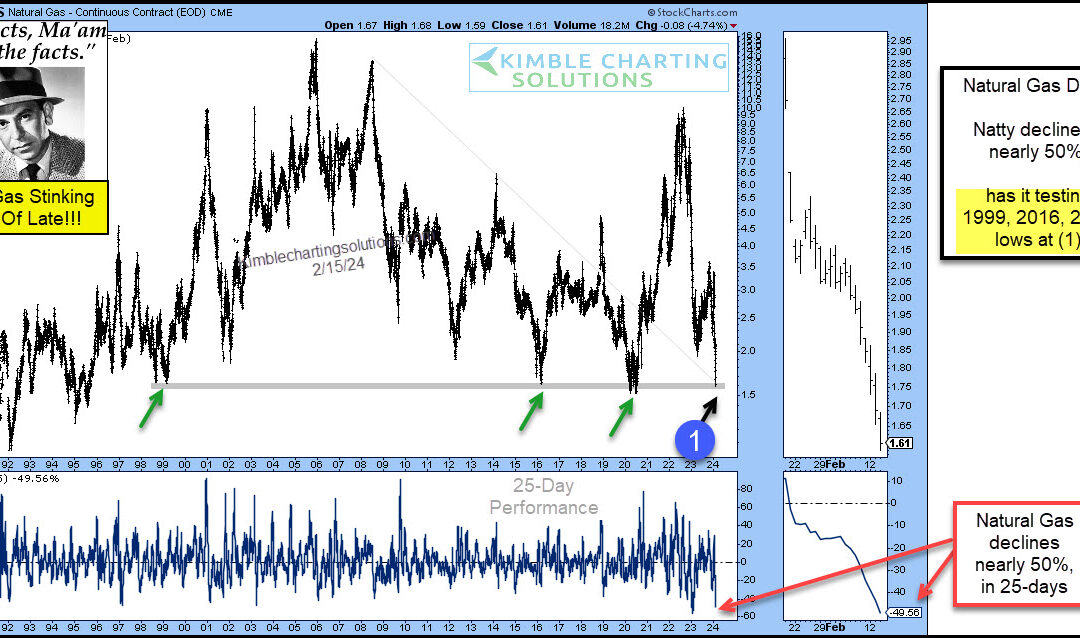
by Chris Kimble | Feb 16, 2024 | Kimble Charting
It’s been a rough go for Natural Gas prices. Even with elevated inflation numbers, Natural Gas is still in crash mode. “The facts, Ma’am. Just the facts.” – Joe Friday Today’s Natural Gas chart highlights the crash in Natural Gas prices. Natty has fallen nearly 50...
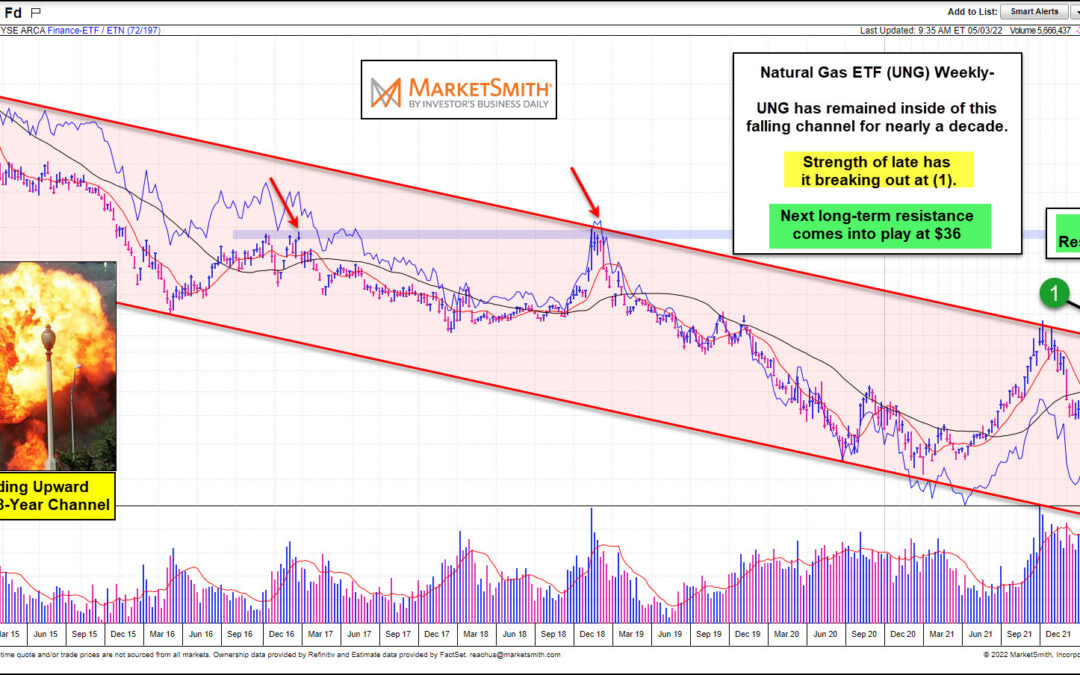
by Chris Kimble | May 4, 2022 | Kimble Charting
Inflation is felt the most with food and energy. Today we look at the latter, focusing on rising natural gas prices. In particular, we look at the “weekly” chart of the United States Natural Gas ETF (UNG). And, as you can see, prices are exploding higher. The rise...
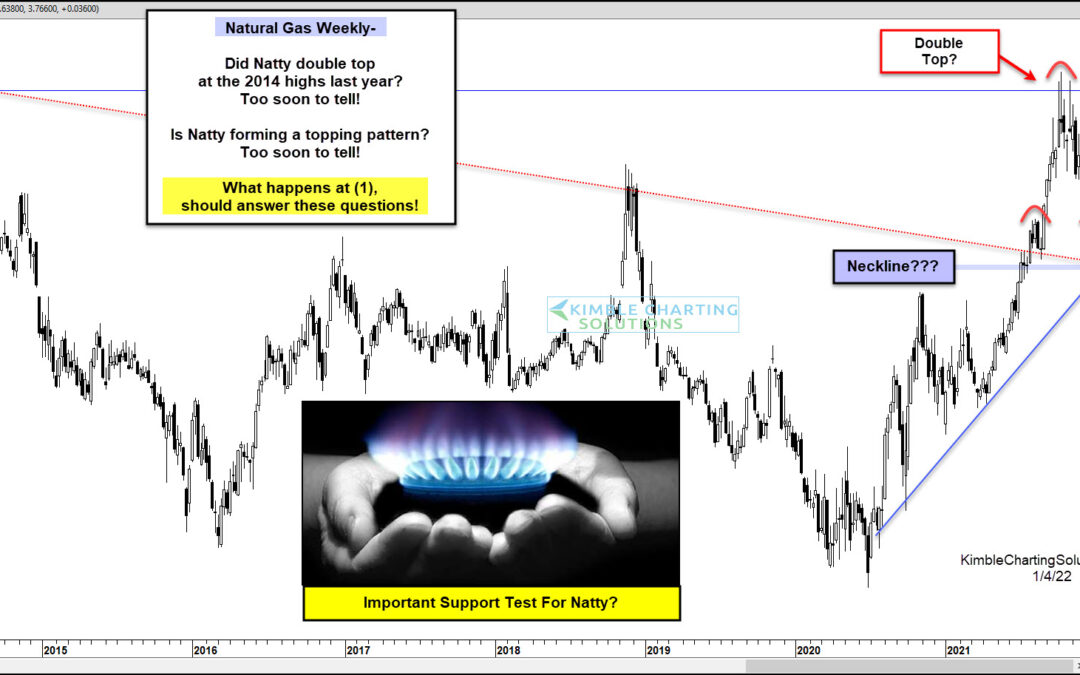
by Chris Kimble | Jan 5, 2022 | Kimble Charting
While several commodities rode strong buying waves to new highs in 2021, some commodities have really cooled off over the past several months. One of them is Natural Gas. And this is our chart in focus today. Looking at the “weekly” chart, you can see that Natty gas...
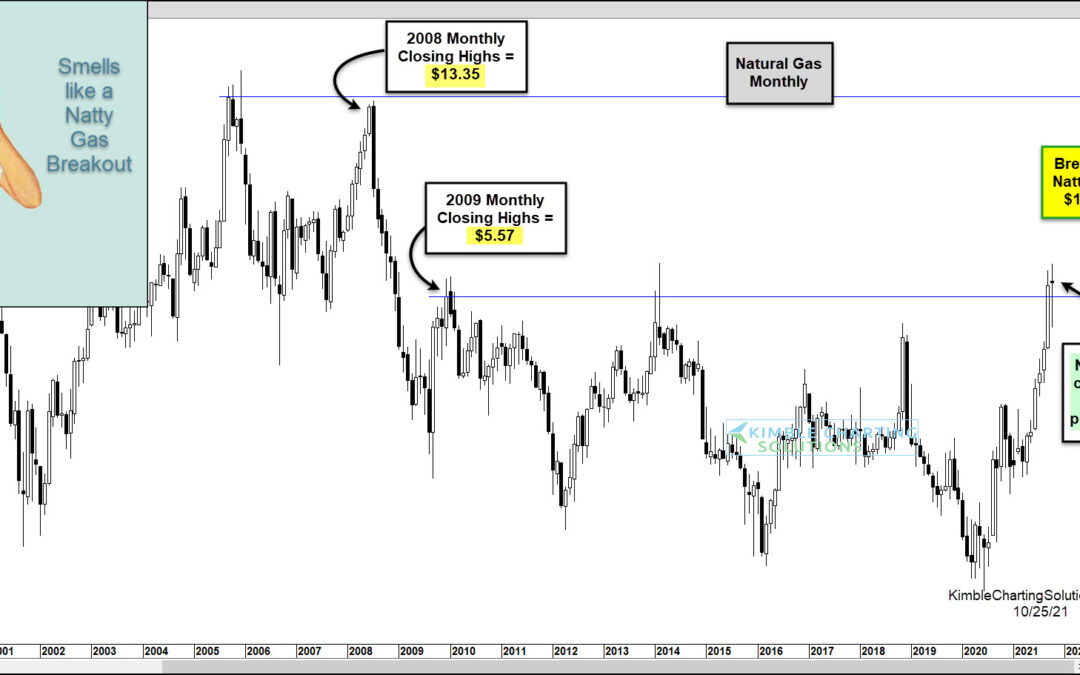
by Chris Kimble | Oct 26, 2021 | Kimble Charting
Rising energy prices are stirring up plenty of inflation concern across the financial markets. And major breakouts for Crude Oil and Natural Gas are looking like an unpleasant October surprise for consumers. This theme has been at the forefront of my research, penning...
by Chris Kimble | Oct 6, 2021 | Kimble Charting
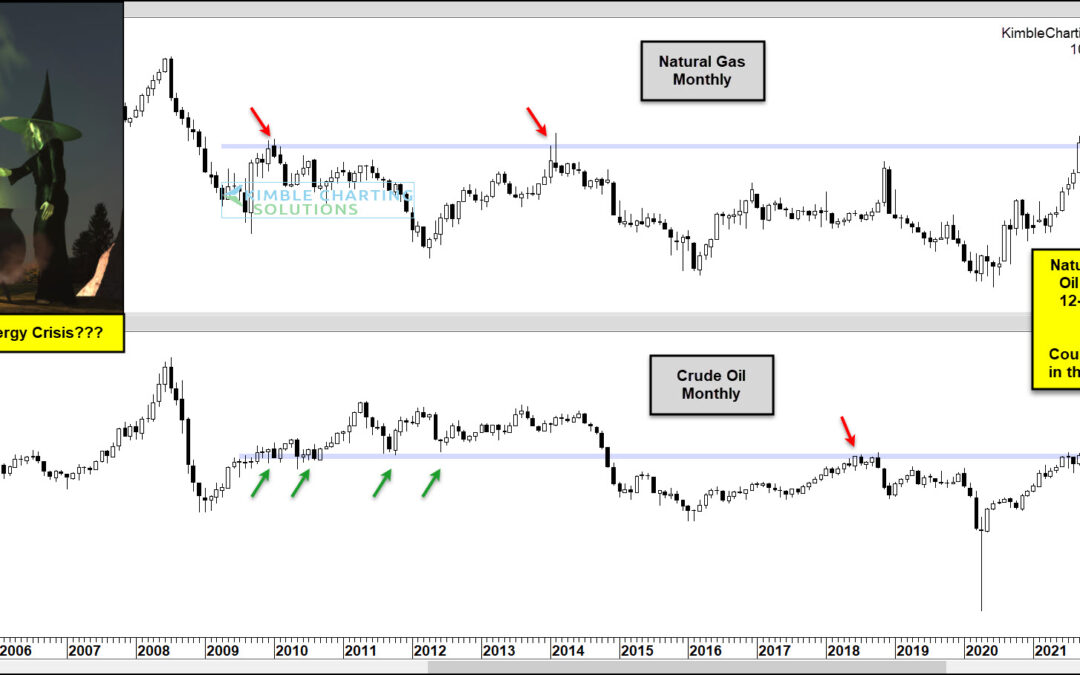
The coronavirus crash in the spring of 2020 left crude oil and natural gas prices decimated. An energy crisis was but a remote thought as oil and gas traded at multi-year lows. Fast forward to today and what a difference 18 months makes! Prices have surged. Late last...
by Chris Kimble | Sep 28, 2021 | Kimble Charting
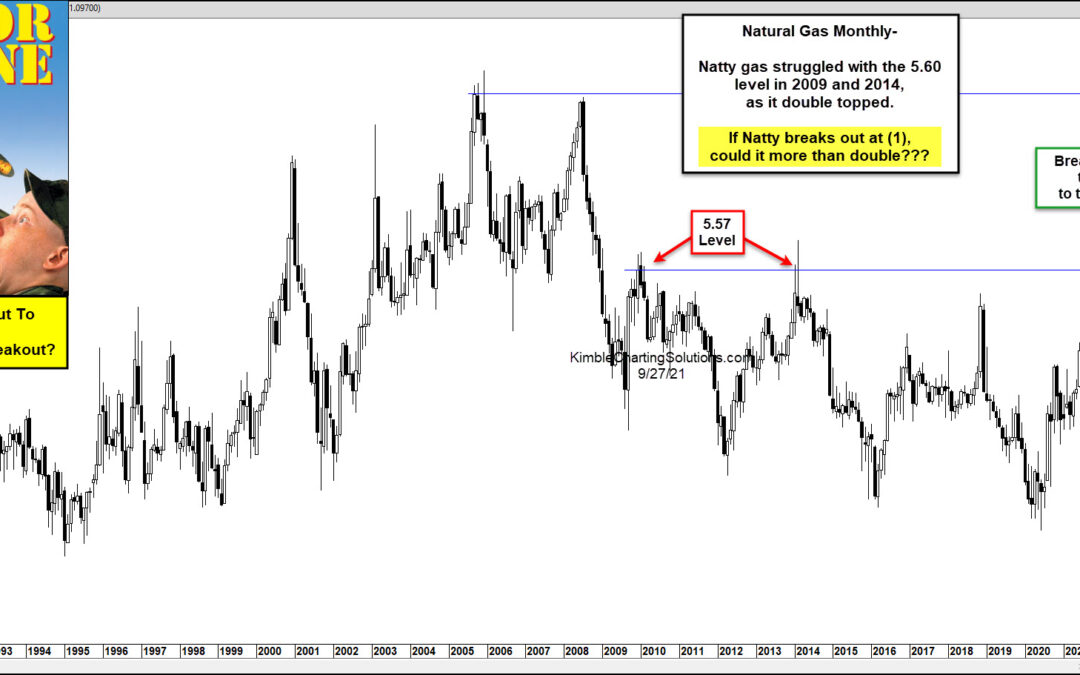
The price of natural gas is a closely watched economic input, similar to crude oil, gasoline, and interest rates. When these economic inputs are rising, then we tend to worry about inflation. Today, we take a closer look at a long-term chart of natural gas. As you can...
by Chris Kimble | Sep 16, 2021 | Kimble Charting
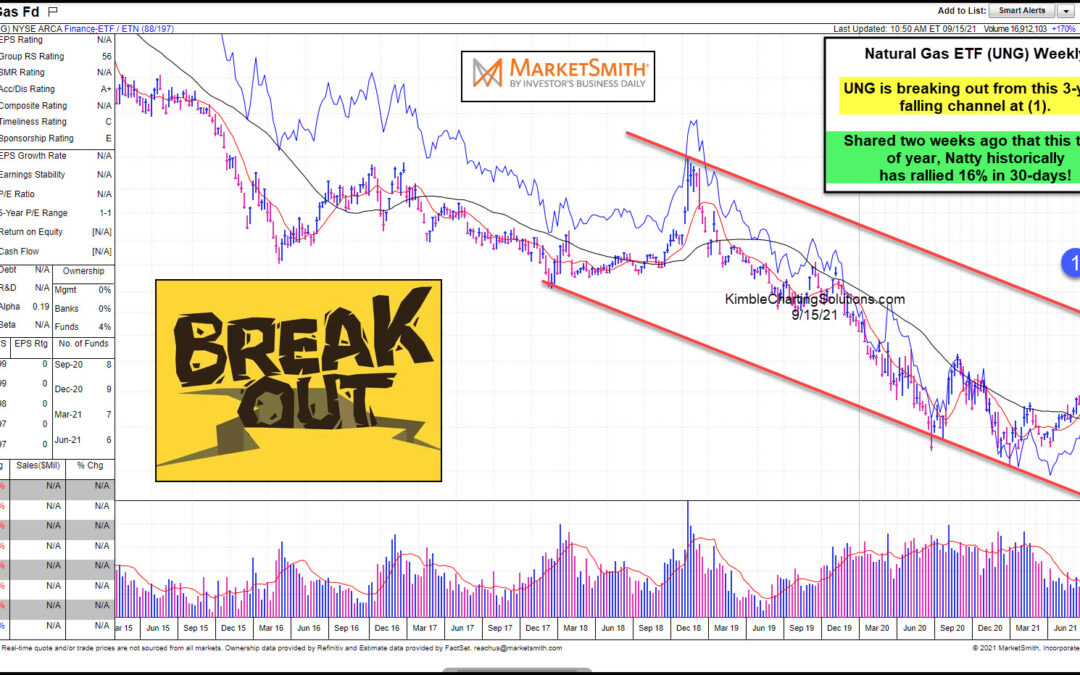
Just two weeks ago, I shared a breakout setup for Natural Gas and wondered, “Is It Time For Natural Gas ETF To Head Much Higher?” That question is being answered this week, as the Natural Gas ETF (UNG) has surged and broken out to new multi-week highs. Today’s...
by Chris Kimble | Sep 3, 2021 | Kimble Charting
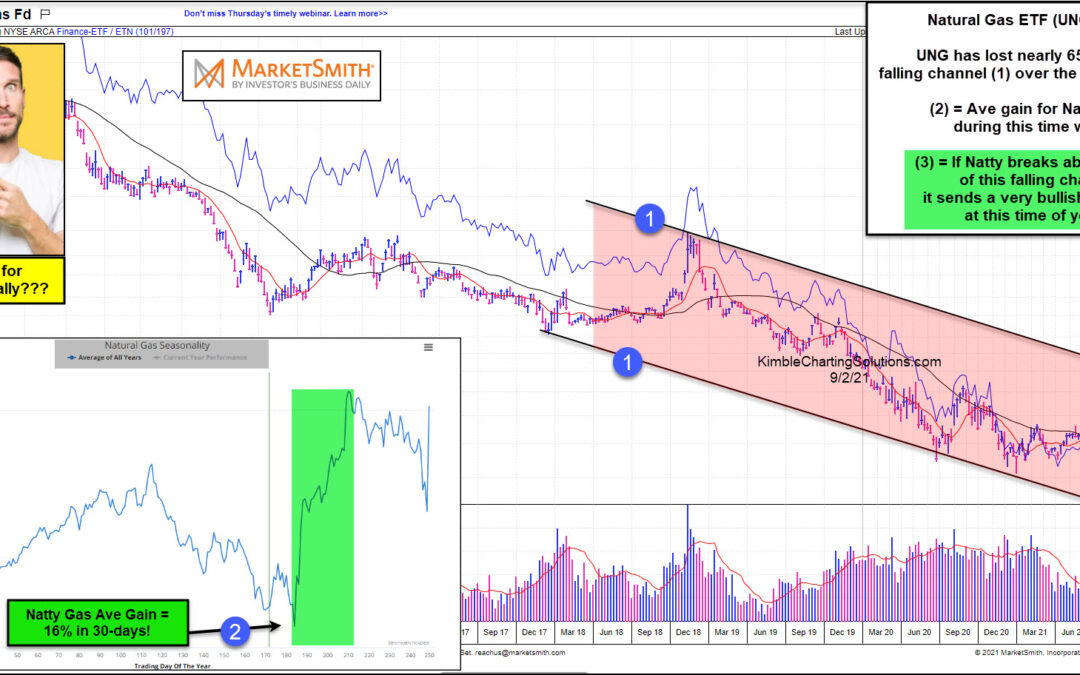
The past 15 years or so have seen Natural Gas mired in a down-trend. But Natural Gas prices are perking up and this has given life to the United States Natural Gas Fund ETF $UNG. Today’s chart looks at a “weekly” chart of this Natural Gas ETF $UNG, from...
